Monitor and troubleshoot rule executions
editMonitor and troubleshoot rule executions
editSeveral tools can help you gain insight into the performance of your detection rules:
- Rule Monitoring tab — The current state of all detection rules and their most recent executions. Go to the Rule Monitoring tab to get an overview of which rules are running, how long they’re taking, and if they’re having any trouble.
- Execution results — Historical data for a single detection rule’s executions over time. Consult the execution results to understand how a particular rule is running and whether it’s creating the alerts you expect.
- Detection rule monitoring dashboard — Visualizations to help you monitor the overall health and performance of Elastic Security’s detection rules. Consult this dashboard for a high-level view of whether your rules are running successfully and how long they’re taking to run, search data, and create alerts.
Refer to the Troubleshoot missing alerts section below for strategies on adjusting rules if they aren’t creating the expected alerts.
Rule Monitoring tab
editTo view a summary of all rule executions (including the most recent failures, execution times, and gaps in rule executions), select the Rule Monitoring tab on the Rules page. To access the tab, find Detection rules (SIEM) in the navigation menu or look for “Detection rules (SIEM)” using the global search field, then go to the Rule Monitoring tab.
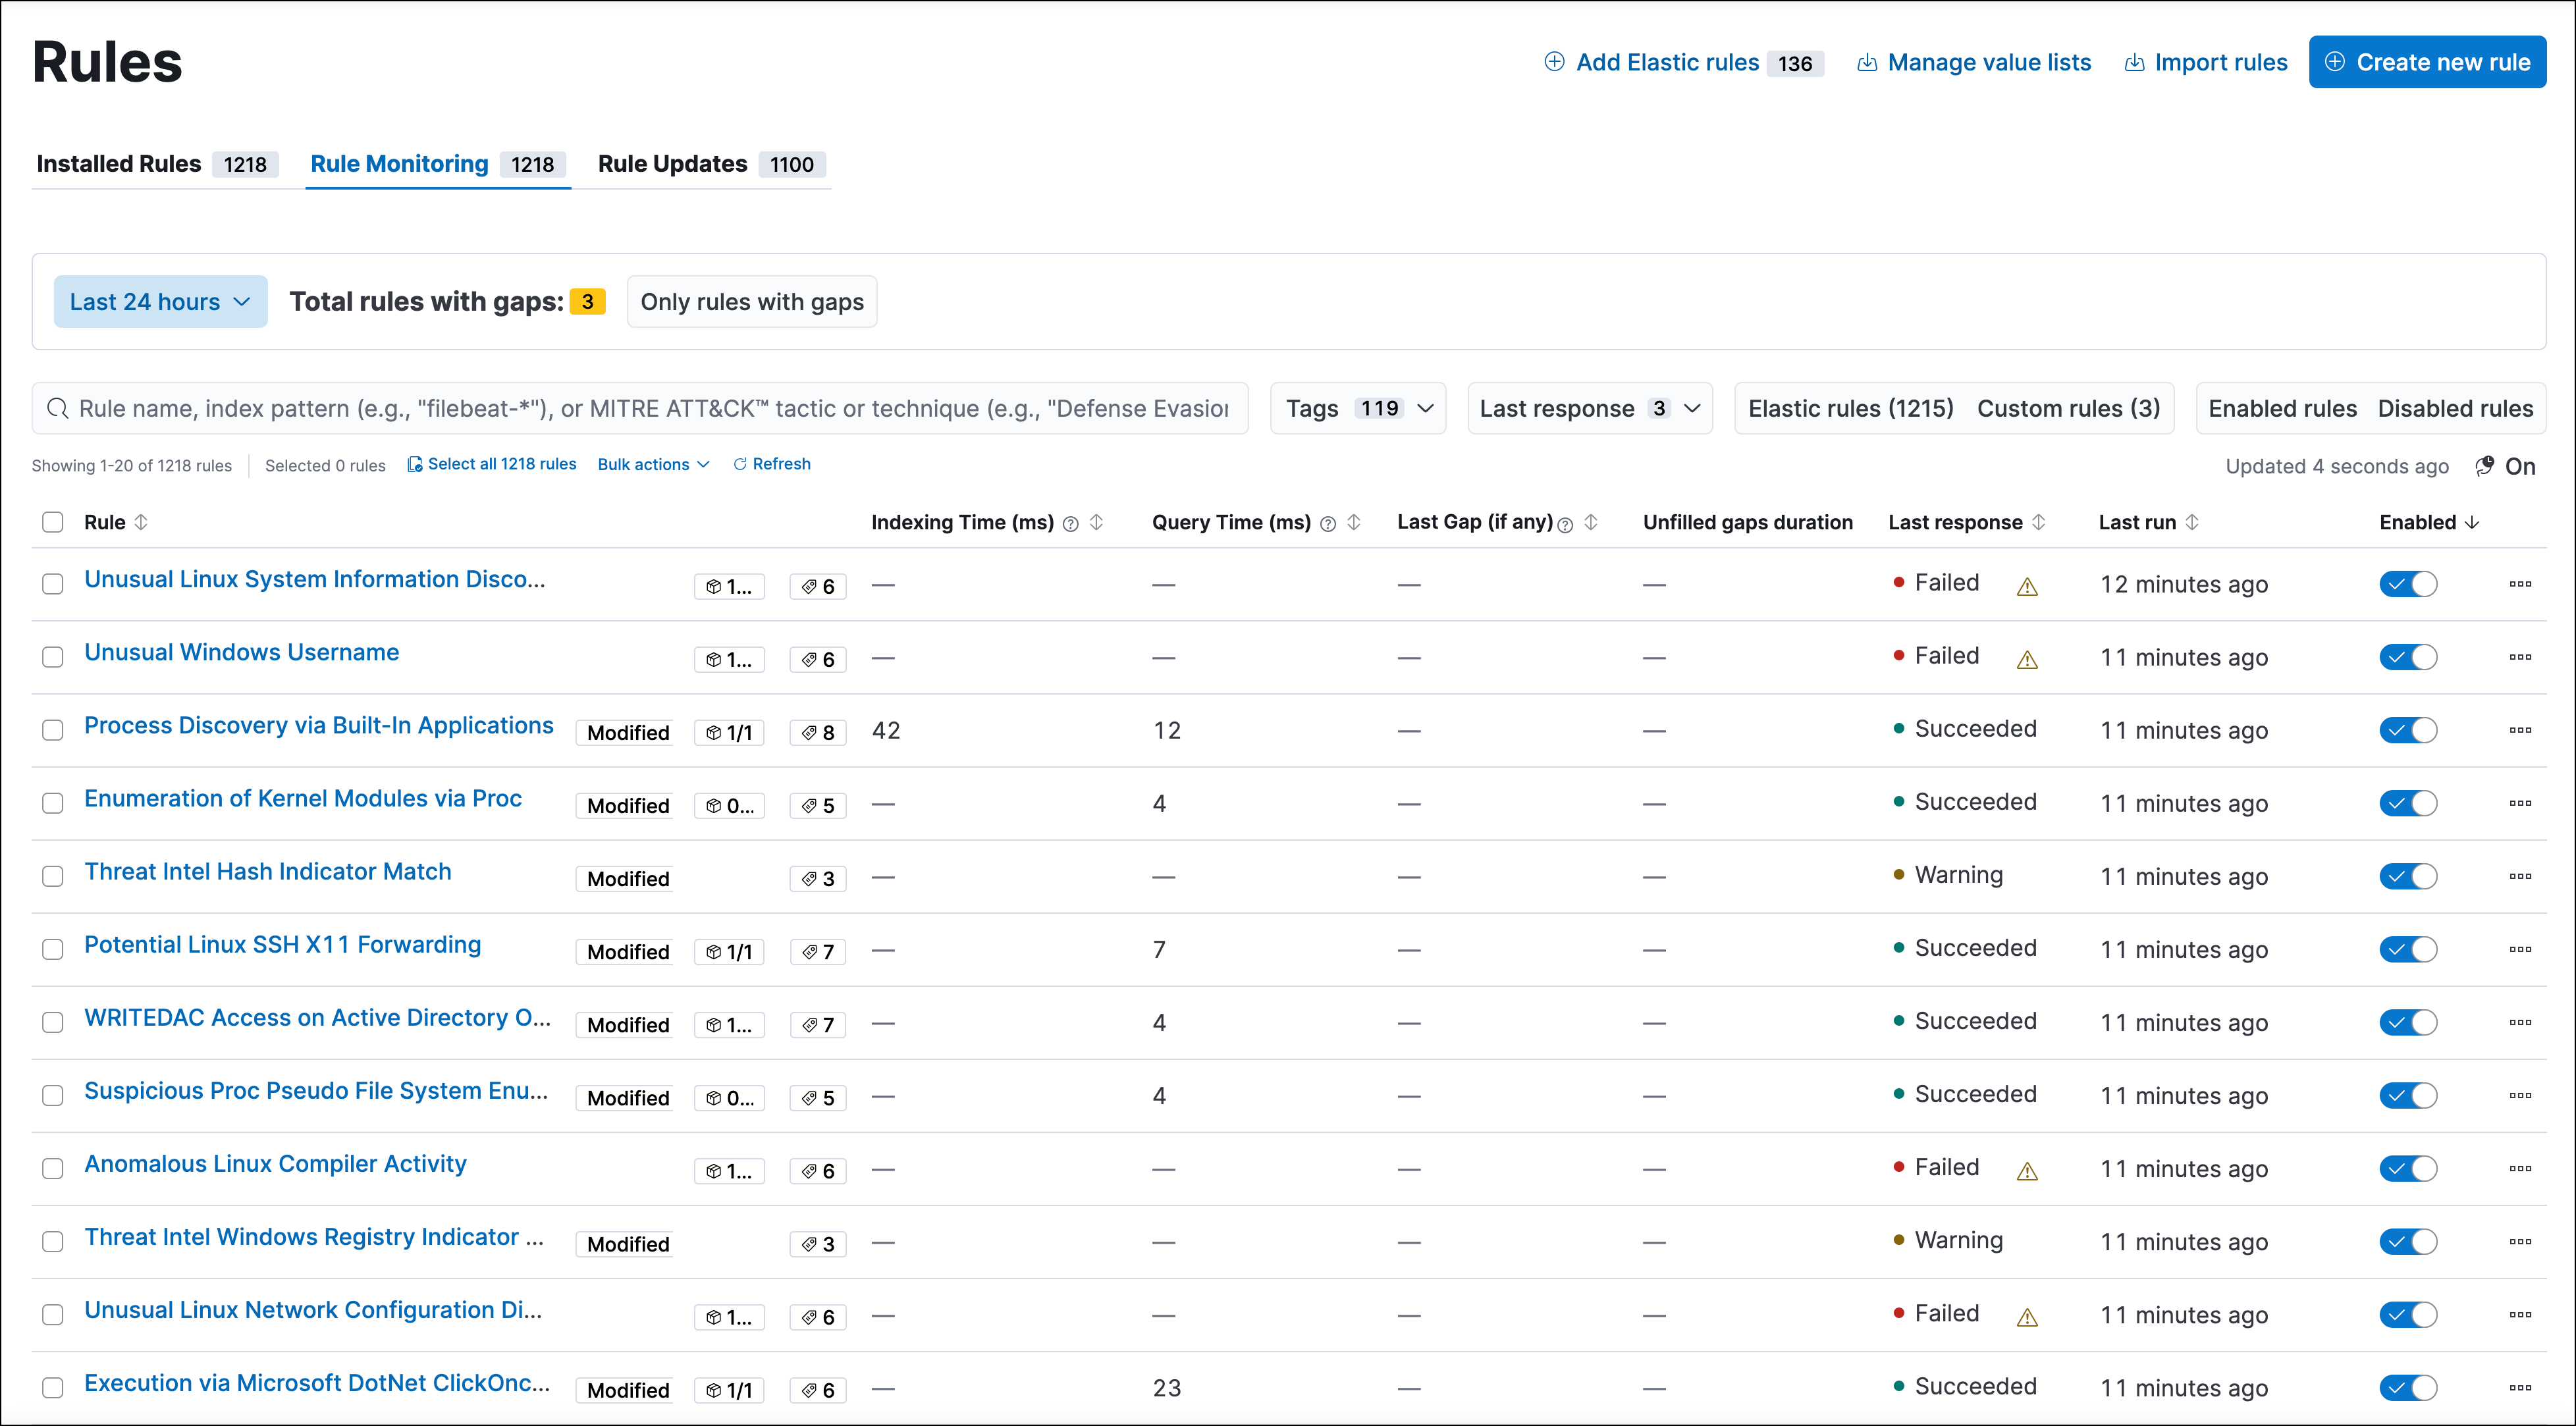
On the Rule Monitoring tab, you can sort and filter rules just like you can on the Installed Rules tab.
To sort the rules list, click any column header. To sort in descending order, click the column header again.
For detailed information on a rule, the alerts it generated, and associated errors, click on its name in the table. This also allows you to perform the same actions that are available on the Installed Rules tab, such as modifying or deleting rules, activating or deactivating rules, exporting or importing rules, and duplicating prebuilt rules.
For information about rule execution gaps (which are periods of time when a rule didn’t run), use the panel above the table. The time filter on the left allows you to select a time range for viewing gap data. The Total rules with gaps: field tells you how many rules have unfilled or partially filled gaps within the selected time range. The Only rules with gaps filter on the right lets you only display rules with unfilled or partially filled gaps.
Within the table, the Last Gap (if any) column conveys how long the most recent gap for a rule lasted. The Unfilled gaps duration column shows whether a rule still has gaps and provides a total sum of the remaining unfilled or partially filled gaps. The total sum can change based on the time range that you select in the panel above the table. If a rule has no gaps, the columns display a dash (––).
For a detailed view of a rule’s gaps, go to the Execution results tab and check the Gaps table.
Execution results tab
editFrom the Execution results tab, you can access the rule’s execution log, monitor and address gaps in a rule’s execution schedule, and check manual runs for the rule. To find the tab, click the rule’s name to open its details, then scroll down.
Execution log table
editEach detection rule execution is logged, including the execution type, the execution’s success or failure, any warning or error messages, how long it took to search for data, create alerts, and complete. This can help you troubleshoot a particular rule if it isn’t behaving as expected (for example, if it isn’t creating alerts or takes a long time to run).
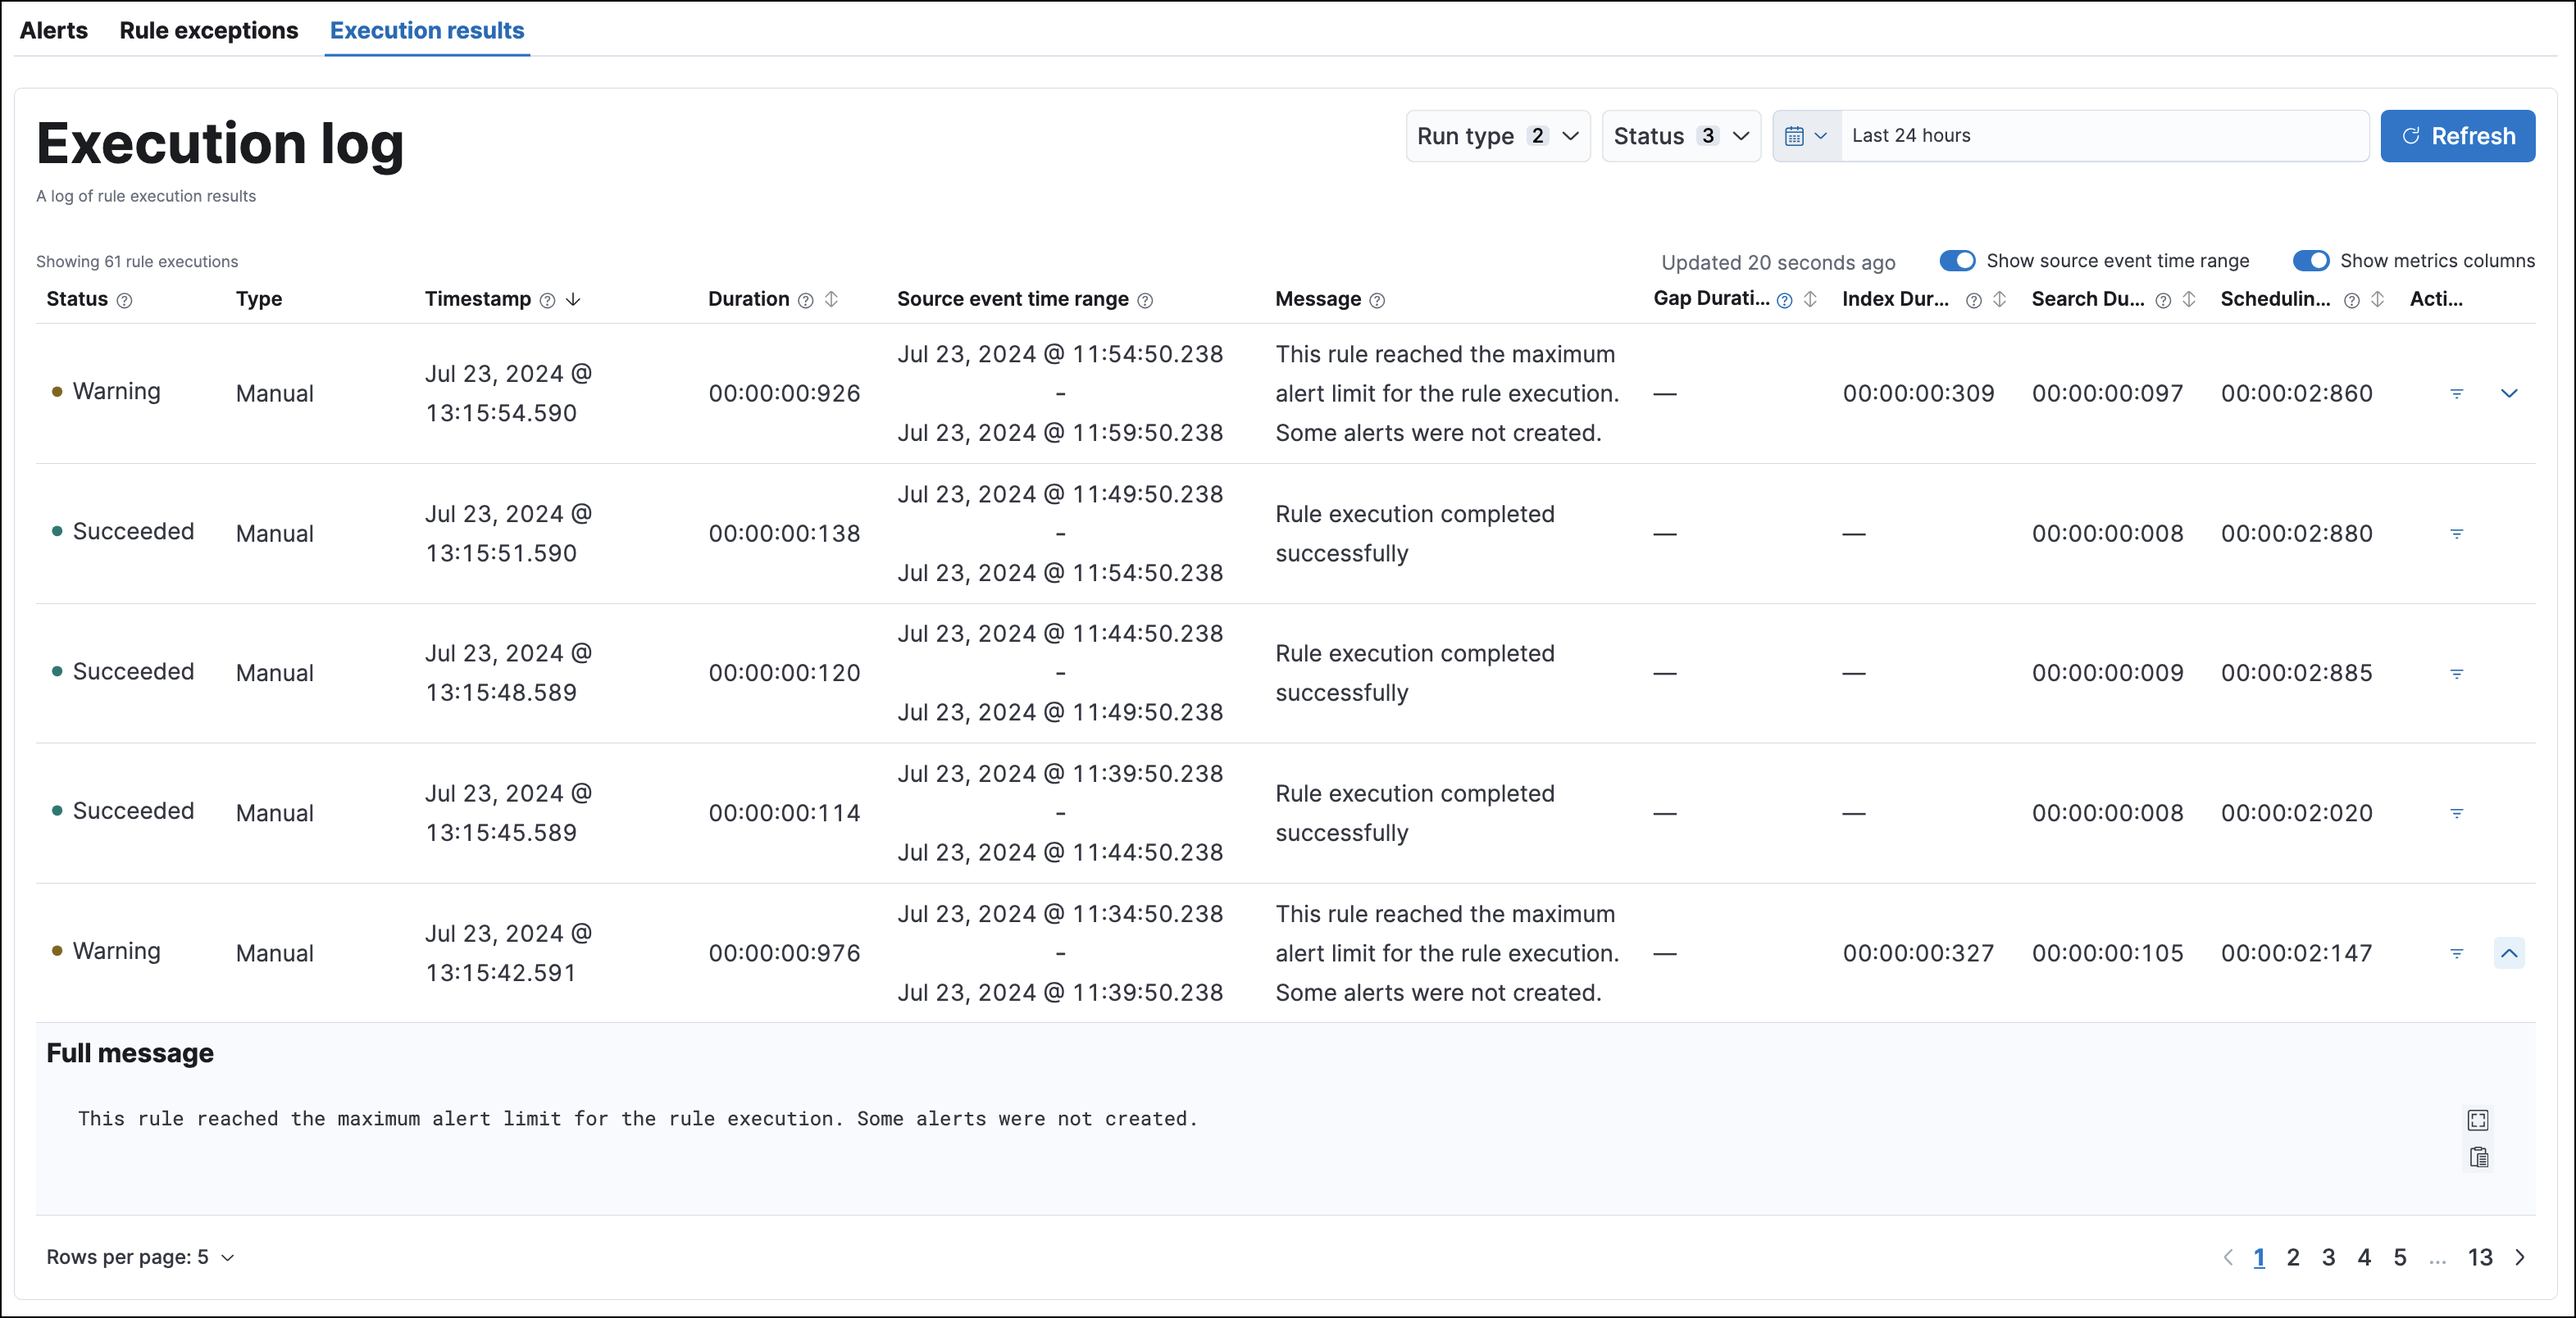
You can hover over each column heading to display a tooltip about that column’s data. Click a column heading to sort the table by that column. Within the Execution log table, you can click the arrow at the end of a row to expand a long warning or error message.
Use these controls to filter what’s included in the logs table:
-
The Run type drop-down filters the table by rule execution type:
- Scheduled: Automatic, scheduled rule executions.
- Manual: Rule executions that were started manually.
-
The Status drop-down filters the table by rule execution status:
- Succeeded: The rule completed its defined search. This doesn’t necessarily mean it generated an alert, just that it ran without error.
- Failed: The rule encountered an error that prevented it from running. For example, a machine learning rule whose corresponding machine learning job wasn’t running.
- Warning: Nothing prevented the rule from running, but it might have returned unexpected results. For example, a custom query rule tried to search an index pattern that couldn’t be found in Elasticsearch.
- The date and time picker sets the time range of rule executions included in the table. This is separate from the global date and time picker at the top of the rule details page.
- The Source event time range button toggles the display of data pertaining to the time range of manual runs.
- The Show metrics columns toggle includes more or less data in the table, pertaining to the timing of each rule execution.
-
The Actions column allows you to show alerts generated from a given rule execution. Click the filter icon (
 ) to create a global search filter based on the rule execution’s ID value. This replaces any previously applied filters, changes the global date and time range to 24 hours before and after the rule execution, and displays a confirmation notification. You can revert this action by clicking Restore previous filters in the notification.
Gaps table
editThis functionality is in beta and is subject to change. The design and code is less mature than official GA features and is being provided as-is with no warranties. Beta features are not subject to the support SLA of official GA features.
Gaps in rule executions are periods of time where a rule didn’t run. They can be caused by various disruptions, including system updates, rule failures, or simply turning off a rule. Addressing gaps is essential for maintaining consistent coverage and avoiding missed alerts.
Refer to the Troubleshoot gaps section for strategies for avoiding gaps.
Use the information in the Gaps table to assess the scope and severity of rule execution gaps. To control what’s shown in the table, you can filter the table by gap status, select a time range for viewing gap data, and sort multiple columns.
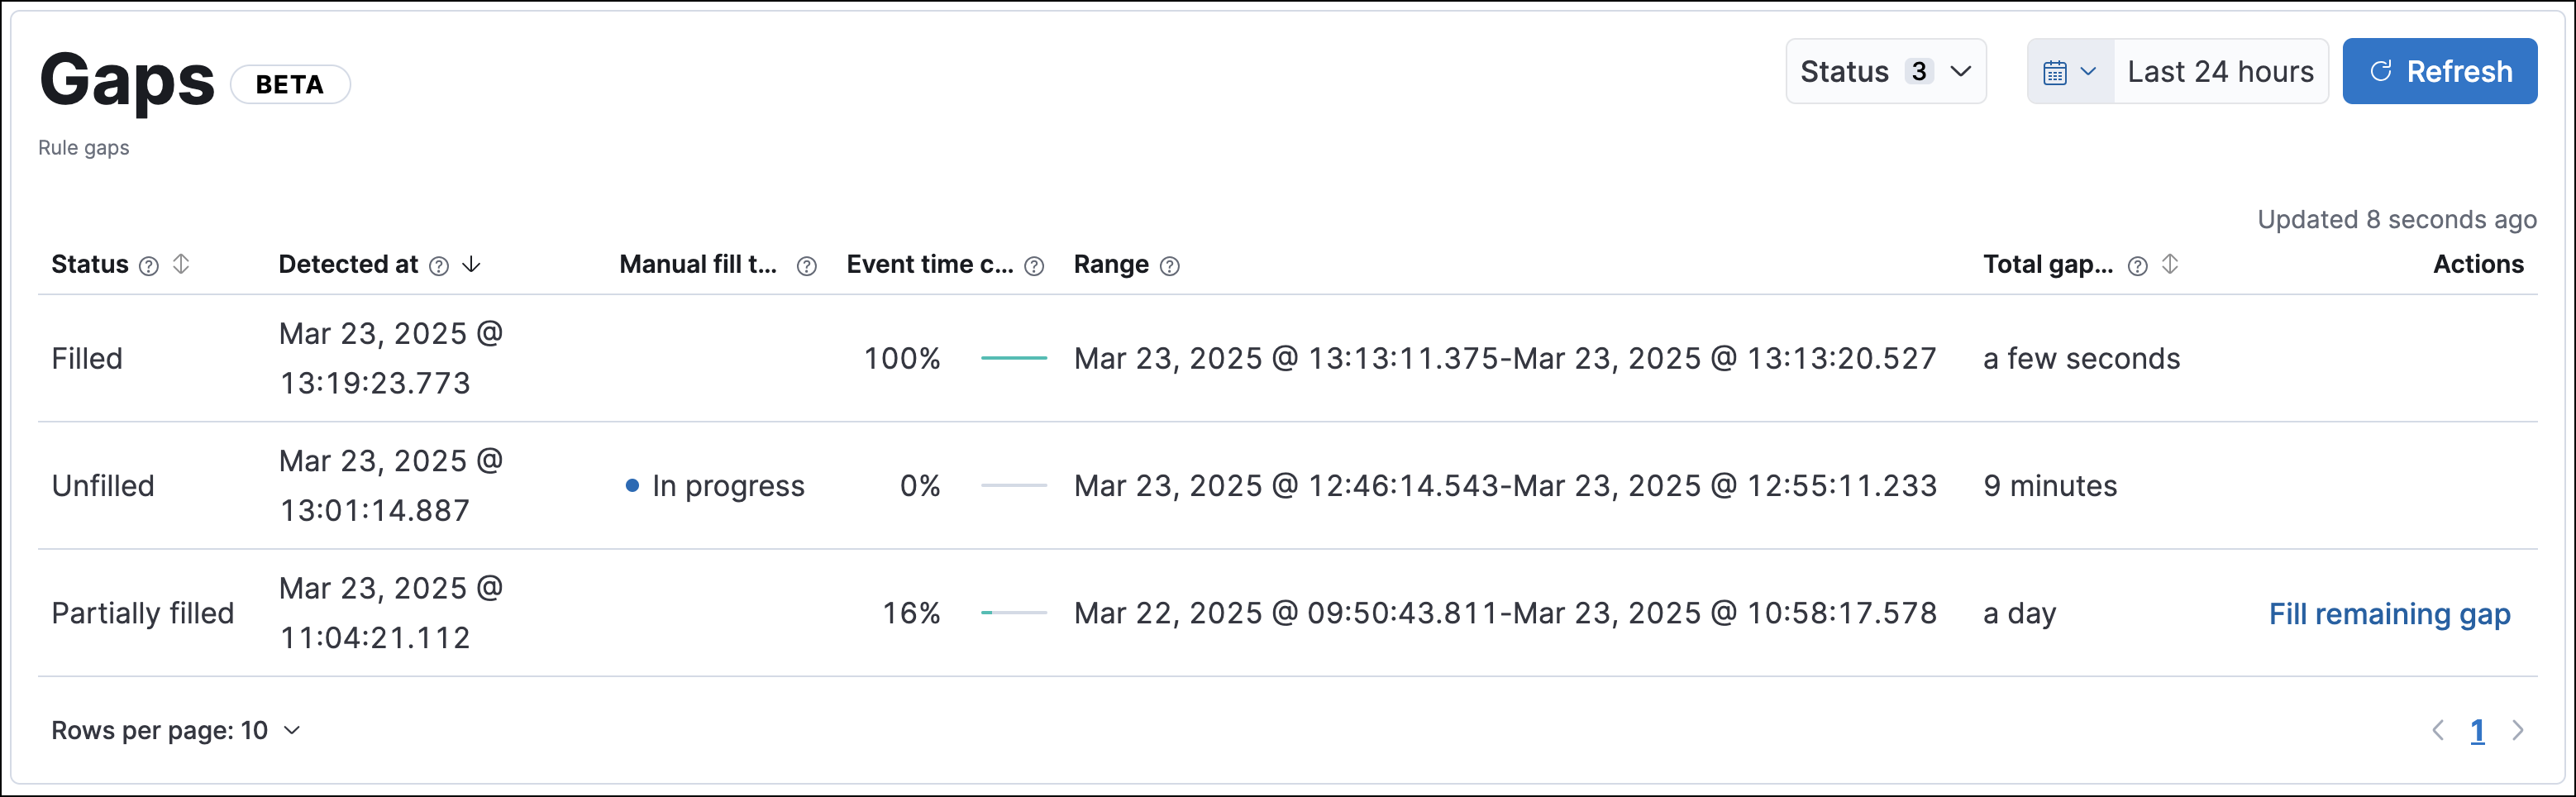
The Gaps table has the following columns:
-
Status: The current state of the gap. It can be
Filled,Partially filled, orUnfilled. - Detected at: The date and time the gap was first discovered.
- Manual fill tasks: The status of the manual run that’s filling the gap. For more details about the manual run, refer to its entry in the Manual runs table.
-
Event time covered: How much progress the manual run has made filling the gap.
If you stop a manual run that hasn’t finished filling a gap, the gap’s status will be set to
Partially filled. To fill the remaining gap, you can select the Fill remaining gap action or manually run the rule over the gap’s time frame. - Range: When the gap started and ended.
- Total gap duration: How long the gap lasted.
- Actions: The actions that you can take for the gap. They can be Fill gap (starts a manual run to fill the gap) or Fill remaining gap (starts a manual run that fills the leftover portion of the gap).
Manual runs table
editYou can manually run enabled rules for a specified period of time to deliberately test them, provide additional rule coverage, or fill gaps in rule executions. Each manual run can produce multiple rule executions, depending on the time range of the run and the rule’s execution schedule.
Manual runs are executed with low priority and limited concurrency, meaning they might take longer to complete. This can be especially apparent for rules requiring multiple executions.
The Manual runs table tracks manual rule executions and provides important details such as:
- The total number of rule executions that the manual run will produce and how many are failing, pending, running, and completed.
-
When the manual run started and the time range that it will cover.
To stop an active run, go to the appropriate row in the table and click Stop run in the Actions column. Completed rule executions for each manual run are logged in the Execution log table.
-
The status of each manual run:
-
Pending: The rule is not yet running. -
Running: The rule is executing during the time range you specified. Some rule types, such as indicator match rules, can take longer to run. -
Error: The rule’s configuration is preventing it from running correctly. For example, the rule’s conditions cannot be validated.
-

Troubleshoot missing alerts
editWhen a rule fails to run close to its scheduled time, some alerts may be missing. There are a number of ways to try to resolve this issue:
You can also use Task Manager in Kibana to troubleshoot background tasks and processes that may be related to missing alerts:
Troubleshoot maximum alerts warning
editWhen a rule reaches the maximum number of alerts it can generate during a single rule execution, the following warning appears on the rule’s details page and in the rule execution log: This rule reached the maximum alert limit for the rule execution. Some alerts were not created.
If you receive this warning, go to the rule’s Alerts tab and check for anything unexpected. Unexpected alerts might be created from data source issues or queries that are too broadly scoped. To further reduce alert volume, you can also add rule exceptions or suppress alerts.
Troubleshoot gaps
editIf you see values in the Gaps column in the Rule Monitoring table or on the Rule details page for a small number of rules, you can edit those rules and increase their additional look-back time.
It’s recommended to set the Additional look-back time to at
least 1 minute. This ensures there are no missing alerts when a rule doesn’t
run exactly at its scheduled time.
Elastic Security prevents duplication. Any duplicate alerts that are discovered during the
Additional look-back time are not created.
If the rule that experiences gaps is an indicator match rule, see how to tune indicator match rules. Also please note that Elastic Security provides limited support for indicator match rules.
If you see gaps for numerous rules:
- If you restarted Kibana when many rules were activated, try deactivating them and then reactivating them in small batches at staggered intervals. This ensures Kibana does not attempt to run all the rules at the same time.
- Consider adding another Kibana instance to your environment.
Troubleshoot ingestion pipeline delay
editEven if your rule runs at its scheduled time, there might still be missing alerts if your ingestion pipeline delay is greater than your rule interval + additional look-back time. Prebuilt rules have a minimum interval + additional look-back time of 6 minutes in Elastic Stack version >=7.11.0. To avoid missed alerts for prebuilt rules, use caution to ensure that ingestion pipeline delays remain below 6 minutes.
In addition, use caution when creating custom rule schedules to ensure that the specified interval + additional look-back time is greater than your deployment’s ingestion pipeline delay.
You can reduce the number of missed alerts due to ingestion pipeline delay by specifying the Timestamp override field value to event.ingested in advanced settings during rule creation or editing. The detection engine uses the value from the event.ingested field as the timestamp when executing the rule.
For example, say an event occurred at 10:00 but wasn’t ingested into Elasticsearch until 10:10 due to an ingestion pipeline delay. If you created a rule to detect that event with an interval + additional look-back time of 6 minutes, and the rule executes at 10:12, it would still detect the event because the event.ingested timestamp was from 10:10, only 2 minutes before the rule executed and well within the rule’s 6-minute interval + additional look-back time.

Troubleshoot missing alerts for machine learning jobs
editMachine learning detection rules use machine learning jobs that have dependencies on data fields populated by the Beats and Elastic Agent integrations. In Elastic Stack version 8.3, new machine learning jobs (prefixed with v3) were released to operate on the ECS fields available at that time.
If you’re using 8.2 or earlier versions of Beats or Elastic Agent with Elastic Stack version 8.3 or later, you may need to duplicate prebuilt rules or create new custom rules before you update the Elastic prebuilt rules. Once you update the prebuilt rules, they will only use v3 machine learning jobs. Duplicating the relevant prebuilt rules before updating them ensures continued coverage by allowing you to keep using v1 or v2 jobs (in the duplicated rules) while also running the new v3 jobs (in the updated prebuilt rules).
- Duplicated rules may result in duplicate anomaly detections and alerts.
-
Ensure that the relevant
v3machine learning jobs are running before you update the Elastic prebuilt rules.
-
If you only have 8.3 or later versions of Beats and Elastic Agent: You can download or update your prebuilt rules and use the latest
v3machine learning jobs. No additional action is required. -
If you only have 8.2 or earlier versions of Beats or Elastic Agent, or a mix of old and new versions: To continue using the
v1andv2machine learning jobs specified by pre-8.3 prebuilt detection rules, you must duplicate affected prebuilt rules before updating them to the latest rule versions. The duplicated rules can continue using the samev1andv2machine learning jobs, and the updated prebuilt machine learning rules will use the newv3machine learning jobs. -
If you have a non-Elastic data shipper that gathers ECS-compatible events: You can use the latest
v3machine learning jobs with no additional action required, as long as your data shipper uses the latest ECS specifications. However, if you’re migrating from machine learning rules usingv1/v2jobs, ensure that you start the relevantv3jobs before updating the Elastic prebuilt rules.
The following Elastic prebuilt rules use the new v3 machine learning jobs to generate alerts. Duplicate their associated v1/v2 prebuilt rules before updating them if you need continued coverage from the v1/v2 machine learning jobs:
-
Unusual Linux Network Port Activity:
v3_linux_anomalous_network_port_activity -
Unusual Linux Network Connection Discovery:
v3_linux_anomalous_network_connection_discovery -
Anomalous Process For a Linux Population:
v3_linux_anomalous_process_all_hosts -
Unusual Linux Username:
v3_linux_anomalous_user_name -
Unusual Linux Process Calling the Metadata Service:
v3_linux_rare_metadata_process -
Unusual Linux User Calling the Metadata Service:
v3_linux_rare_metadata_user -
Unusual Process For a Linux Host:
v3_rare_process_by_host_linux -
Unusual Process For a Windows Host:
v3_rare_process_by_host_windows -
Unusual Windows Network Activity:
v3_windows_anomalous_network_activity -
Unusual Windows Path Activity:
v3_windows_anomalous_path_activity -
Anomalous Windows Process Creation:
v3_windows_anomalous_process_creation -
Anomalous Process For a Windows Population:
v3_windows_anomalous_process_all_hosts -
Unusual Windows Username:
v3_windows_anomalous_user_name -
Unusual Windows Process Calling the Metadata Service:
v3_windows_rare_metadata_process -
Unusual Windows User Calling the Metadata Service:
v3_windows_rare_metadata_user