What’s new in 8.18
editWhat’s new in 8.18
editHere are the highlights of what’s new and improved in Elastic Security. For detailed information about this release, check out our release notes.
Other versions: 8.17 | 8.16 | 8.15 | 8.14 | 8.13 | 8.12 | 8.11 | 8.10 | 8.9 | 8.8 | 8.7 | 8.6 | 8.5 | 8.4 | 8.3 | 8.2 | 8.1 | 8.0 | 7.17 | 7.16 | 7.15 | 7.14 | 7.13 | 7.12 | 7.11 | 7.10 | 7.9
Generative AI enhancements
editAutomatically migrate Splunk SIEM rules
editAutomatic Migration for detection rules helps you quickly convert SIEM rules from the Splunk Processing Language (SPL) to the Elasticsearch Query Language (ES|QL). If comparable Elastic-authored rules exist, it simplifies onboarding by mapping your rules to them. Otherwise, it creates custom rules on the fly so you can verify and edit them instead of writing them from scratch.

Automatic Import improvements
editAutomatic Import now allows you to select API (CEL input) as a data source and to provide the associated OpenAPI specification (OAS) file to automatically generate a CEL program to consume an API.
Control which alerts Attack Discovery analyzes
editYou can now specify which alerts Attack Discovery analyzes using a date and time selector and a KQL filter.

View citations and documentation in AI Assistant
editAI Assistant can now cite sources, including Elastic’s product documentation, threat reports, and more.
Entity Analytics enhancements
editMonitor services installed in your environment
editThe entity store now supports a new service entity type, expanding the range of entities you can track and monitor in your environment. Previously, only user and host entities were supported. With the addition of the service entity type, you can now investigate and protect the various services installed across your infrastructure.

Verify entity store engine status
editUse the new Engine Status tab on the Entity Store page to verify which engines are installed in your environment and check their current statuses. This tab provides a centralized view for monitoring engine health, allowing you to ensure proper functionality, and troubleshoot any potential issues.

Entity risk scoring and entity store are generally available
editEntity risk scoring and entity store are moving from technical preview to general availability. Use these features to monitor the risk score of entities in your environment and query persisted entity metadata.
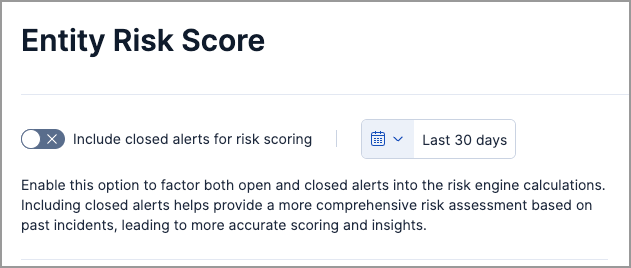
Include closed alerts in risk score calculations
editWhen turning on the risk engine, you now have the option to include Closed alerts in risk scoring calculations. By default, only Open and Acknowledged alerts are included. Additionally, you can specify a custom date and time range for the calculation, allowing for more flexible and tailored risk monitoring.
Detection rules and alerts enhancements
editCustomize and manage prebuilt detection rules
editPreviously, you had limited ability to customize prebuilt rules, couldn’t export or import them, and could only accept Elastic changes during rule updates. Now, you can do so much more.
After installing prebuilt rules, you’re now able to edit most of their settings to fit your custom needs. When updating rules, Elastic retains your changes whenever possible and helps you auto-resolve conflicts that may occur. Additional enhancements, such as the ability to compare different versions of a rule and edit the final update, have also been made to give you more control over the prebuilt rule update experience.
In addition to customizing prebuilt rules, you’re now able to:
- Export and import prebuilt rules that have been modified or left unchanged.
- Bulk-edit prebuilt rules settings, such as custom highlighted fields or tags.
Manual run enhancements
editThe manual runs functionality is now generally available and includes the following new features:
- Almost all rule actions are supported and can be activated when you run a rule manually.
- Gaps in rule executions—which can lead to missed alerts and inconsistent rule coverage—can be monitored and manually filled.

Preview logged Elasticsearch requests for more rule types
editYou can now preview logged Elasticsearch requests for new terms, threshold, custom, and machine learning rule types.
Suppress alerts for event correlation rules
editAlert suppression is now supported for event correlation rules using sequence queries.
Investigations enhancements
editControl access to Timeline and notes with more granularity
editYou now have more control over role access to Timeline and notes. When you upgrade to 8.18, roles that previously had All or Read access to Security will inherit these privileges for Timelines and notes.
Visualizations are available by default in the alert details flyout
editThe securitySolution:enableVisualizationsInFlyout advanced setting is now turned on by default and generally available. The Session View and Analyzer Graph sub-tabs in the alert details flyout are also available by default and generally available.
Quickly access visited places from the alert details flyout
editFrom the alert details flyout, you can click the history icon (![]() ) to display a list of places that you visited from the alert’s details flyout—for example, flyouts for other alerts or users. Click any list entry to quickly access the item’s details.
) to display a list of places that you visited from the alert’s details flyout—for example, flyouts for other alerts or users. Click any list entry to quickly access the item’s details.
Response actions enhancements
editUpdated privileges for third-party response actions
editA new Kibana feature privilege is now required when configuring third-party response actions. To find and assign the privilege, navigate to Management → Actions and Connectors → Endpoint Security.
Run a script on CrowdStrike-enrolled hosts
editUsing Elastic’s CrowdStrike integration and connector, you can now run a script on CrowdStrike-enrolled hosts by providing one of the following:
- The full script content
- The name of the script stored in a cloud storage location
- The file path of the script located on the host machine
Isolate and release Microsoft Defender for Endpoint–enrolled hosts
editUsing Elastic’s Microsoft Defender for Endpoint integration and connector, you can now perform response actions on hosts enrolled in Microsoft Defender’s endpoint protection system. These actions are available in this release:
- Isolate a host from the network
- Release an isolated host
Third-party response actions are generally available
editThird-party response actions are moving from technical preview to general availability. This includes response capabilities for Sentinel One, Crowdstrike, and Microsoft Defender for Endpoint.
Increase Osquery timeout to 24 hours
editWhen running Osquery queries, you can now set a timeout period of up to 24 hours (86,400 seconds). Overwriting the query’s default timeout period allows you to support queries that take longer to run.
Increased support for agentless integrations
editAn additional 14 integrations can now be deployed using agentless technology.