ES|QL visualizations
editES|QL visualizations
editYou can add ES|QL visualizations to a dashboard directly from queries in Discover, or you can start from a dashboard.
Edit and add from Discover
editIn Discover, typing ES|QL queries automatically shows a visualization. The visualization type depends on the content of the query: histogram, bar charts, etc. You can manually make changes to that visualization and edit its type and display options using the
pencil button ![]() .
.
You can then Save and add it to an existing or a new dashboard using the save button of the visualization ![]() .
.
Create from dashboard
edit- From your dashboard, select Add panel.
-
Choose ES|QL under Visualizations. An ES|QL editor appears and lets you configure your query and its associated visualization. The Suggestions panel can help you find alternative ways to configure the visualization.
Check the ES|QL reference to get familiar with the syntax and optimize your query.
-
When editing your query or its configuration, run the query to update the preview of the visualization.
- You can bind controls to your ES|QL visualizations in dashboards by creating ES|QL controls.
- Select Apply and close to save the visualization to the dashboard.
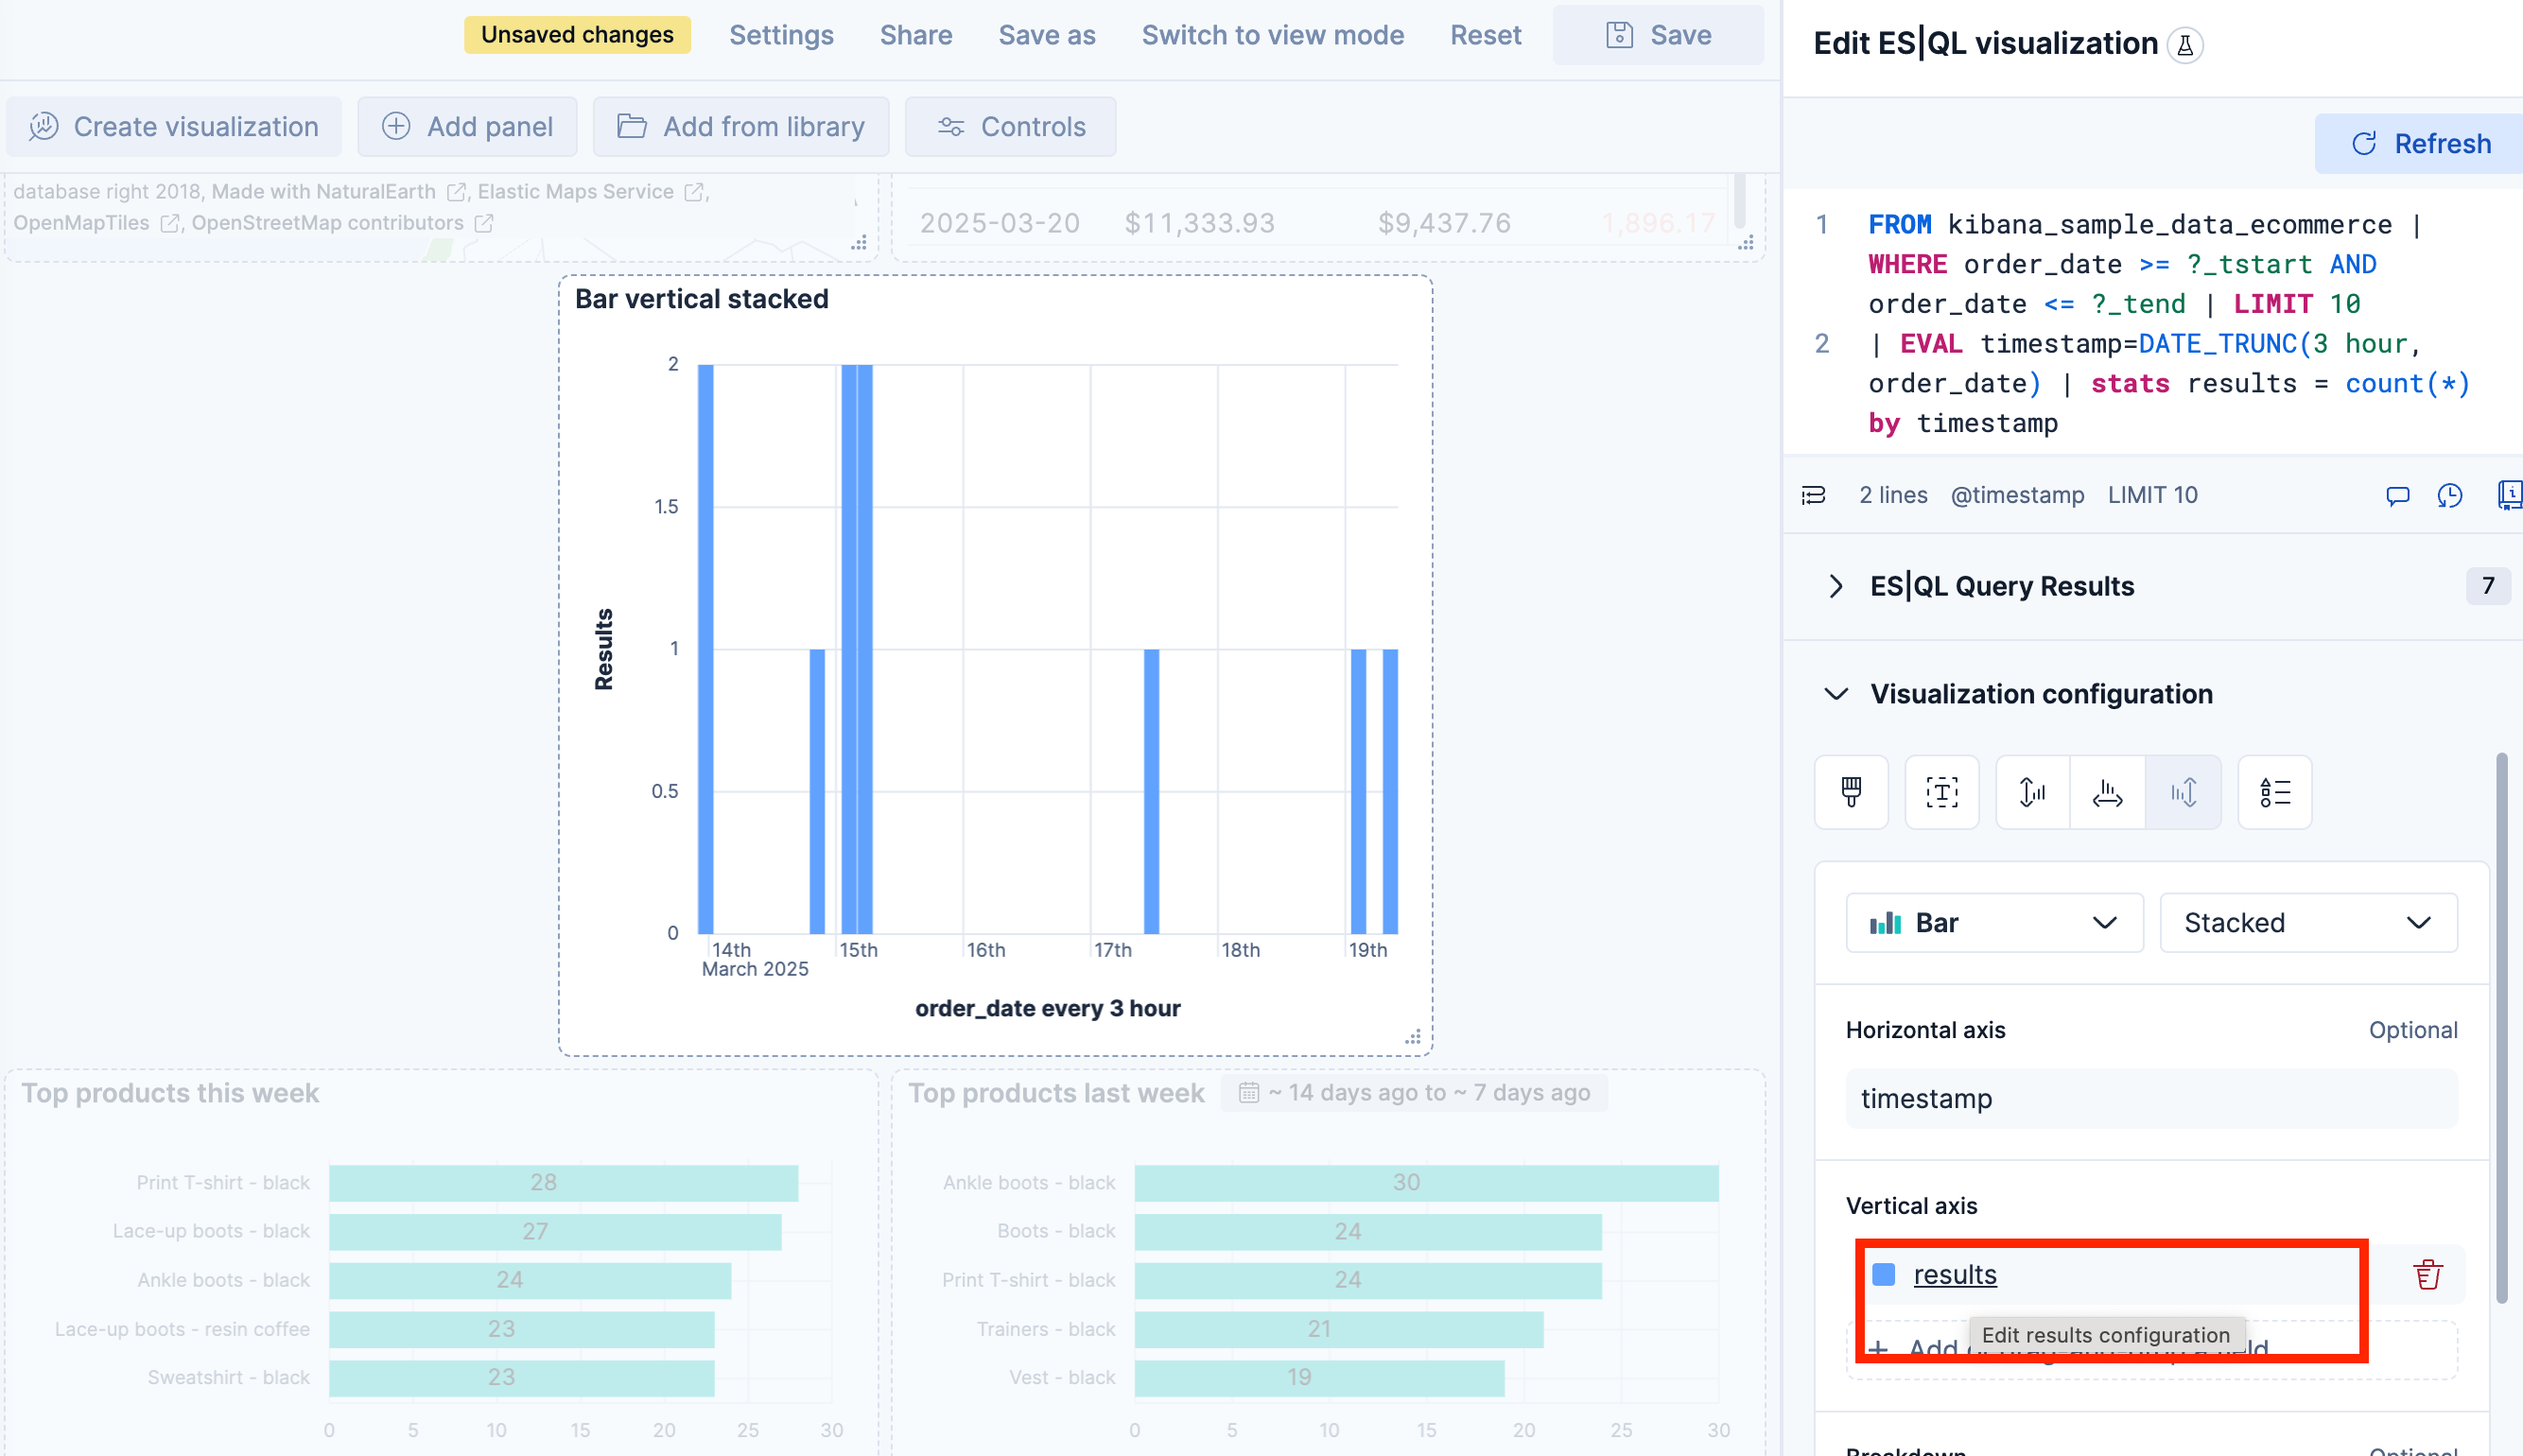
Customize the appearance of your ES|QL visualization
editWhen editing an ES|QL visualization, you can customize the appearance of the chart. To do that:
-
Click one of the fields representing an axis of the chart to open its details.
-
Define the appearance of your choice from the available options.
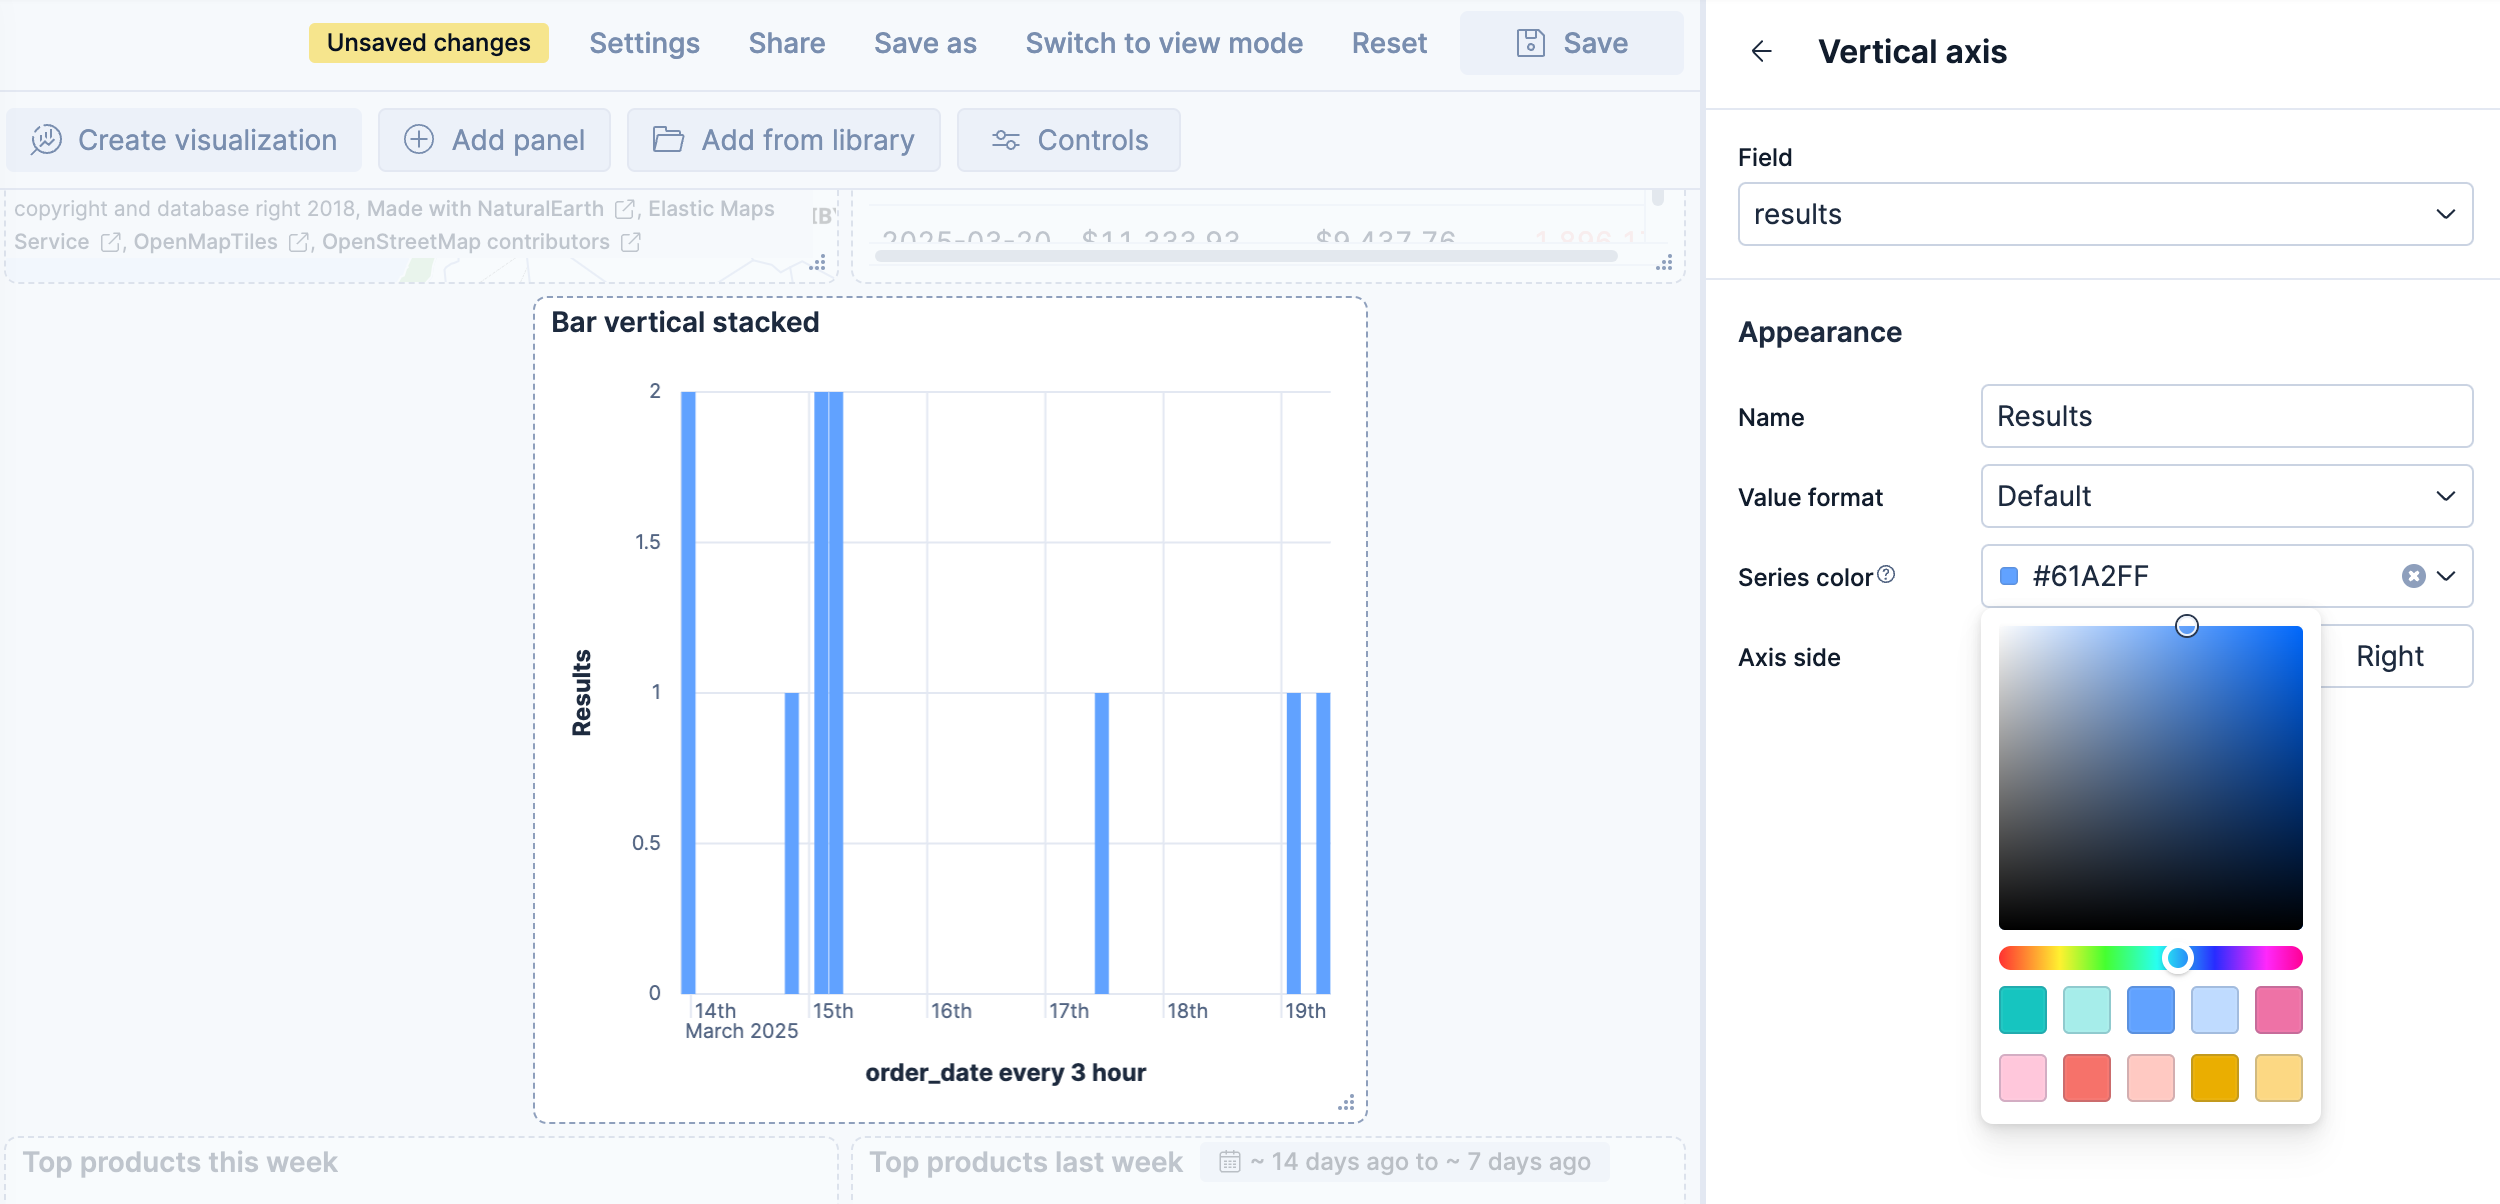
- Return to the previous menu, then Apply and close the configuration to save your changes.