IMPORTANT: No additional bug fixes or documentation updates
will be released for this version. For the latest information, see the
current release documentation.
Observability
edit
IMPORTANT: This documentation is no longer updated. Refer to Elastic's version policy and the latest documentation.
Observability
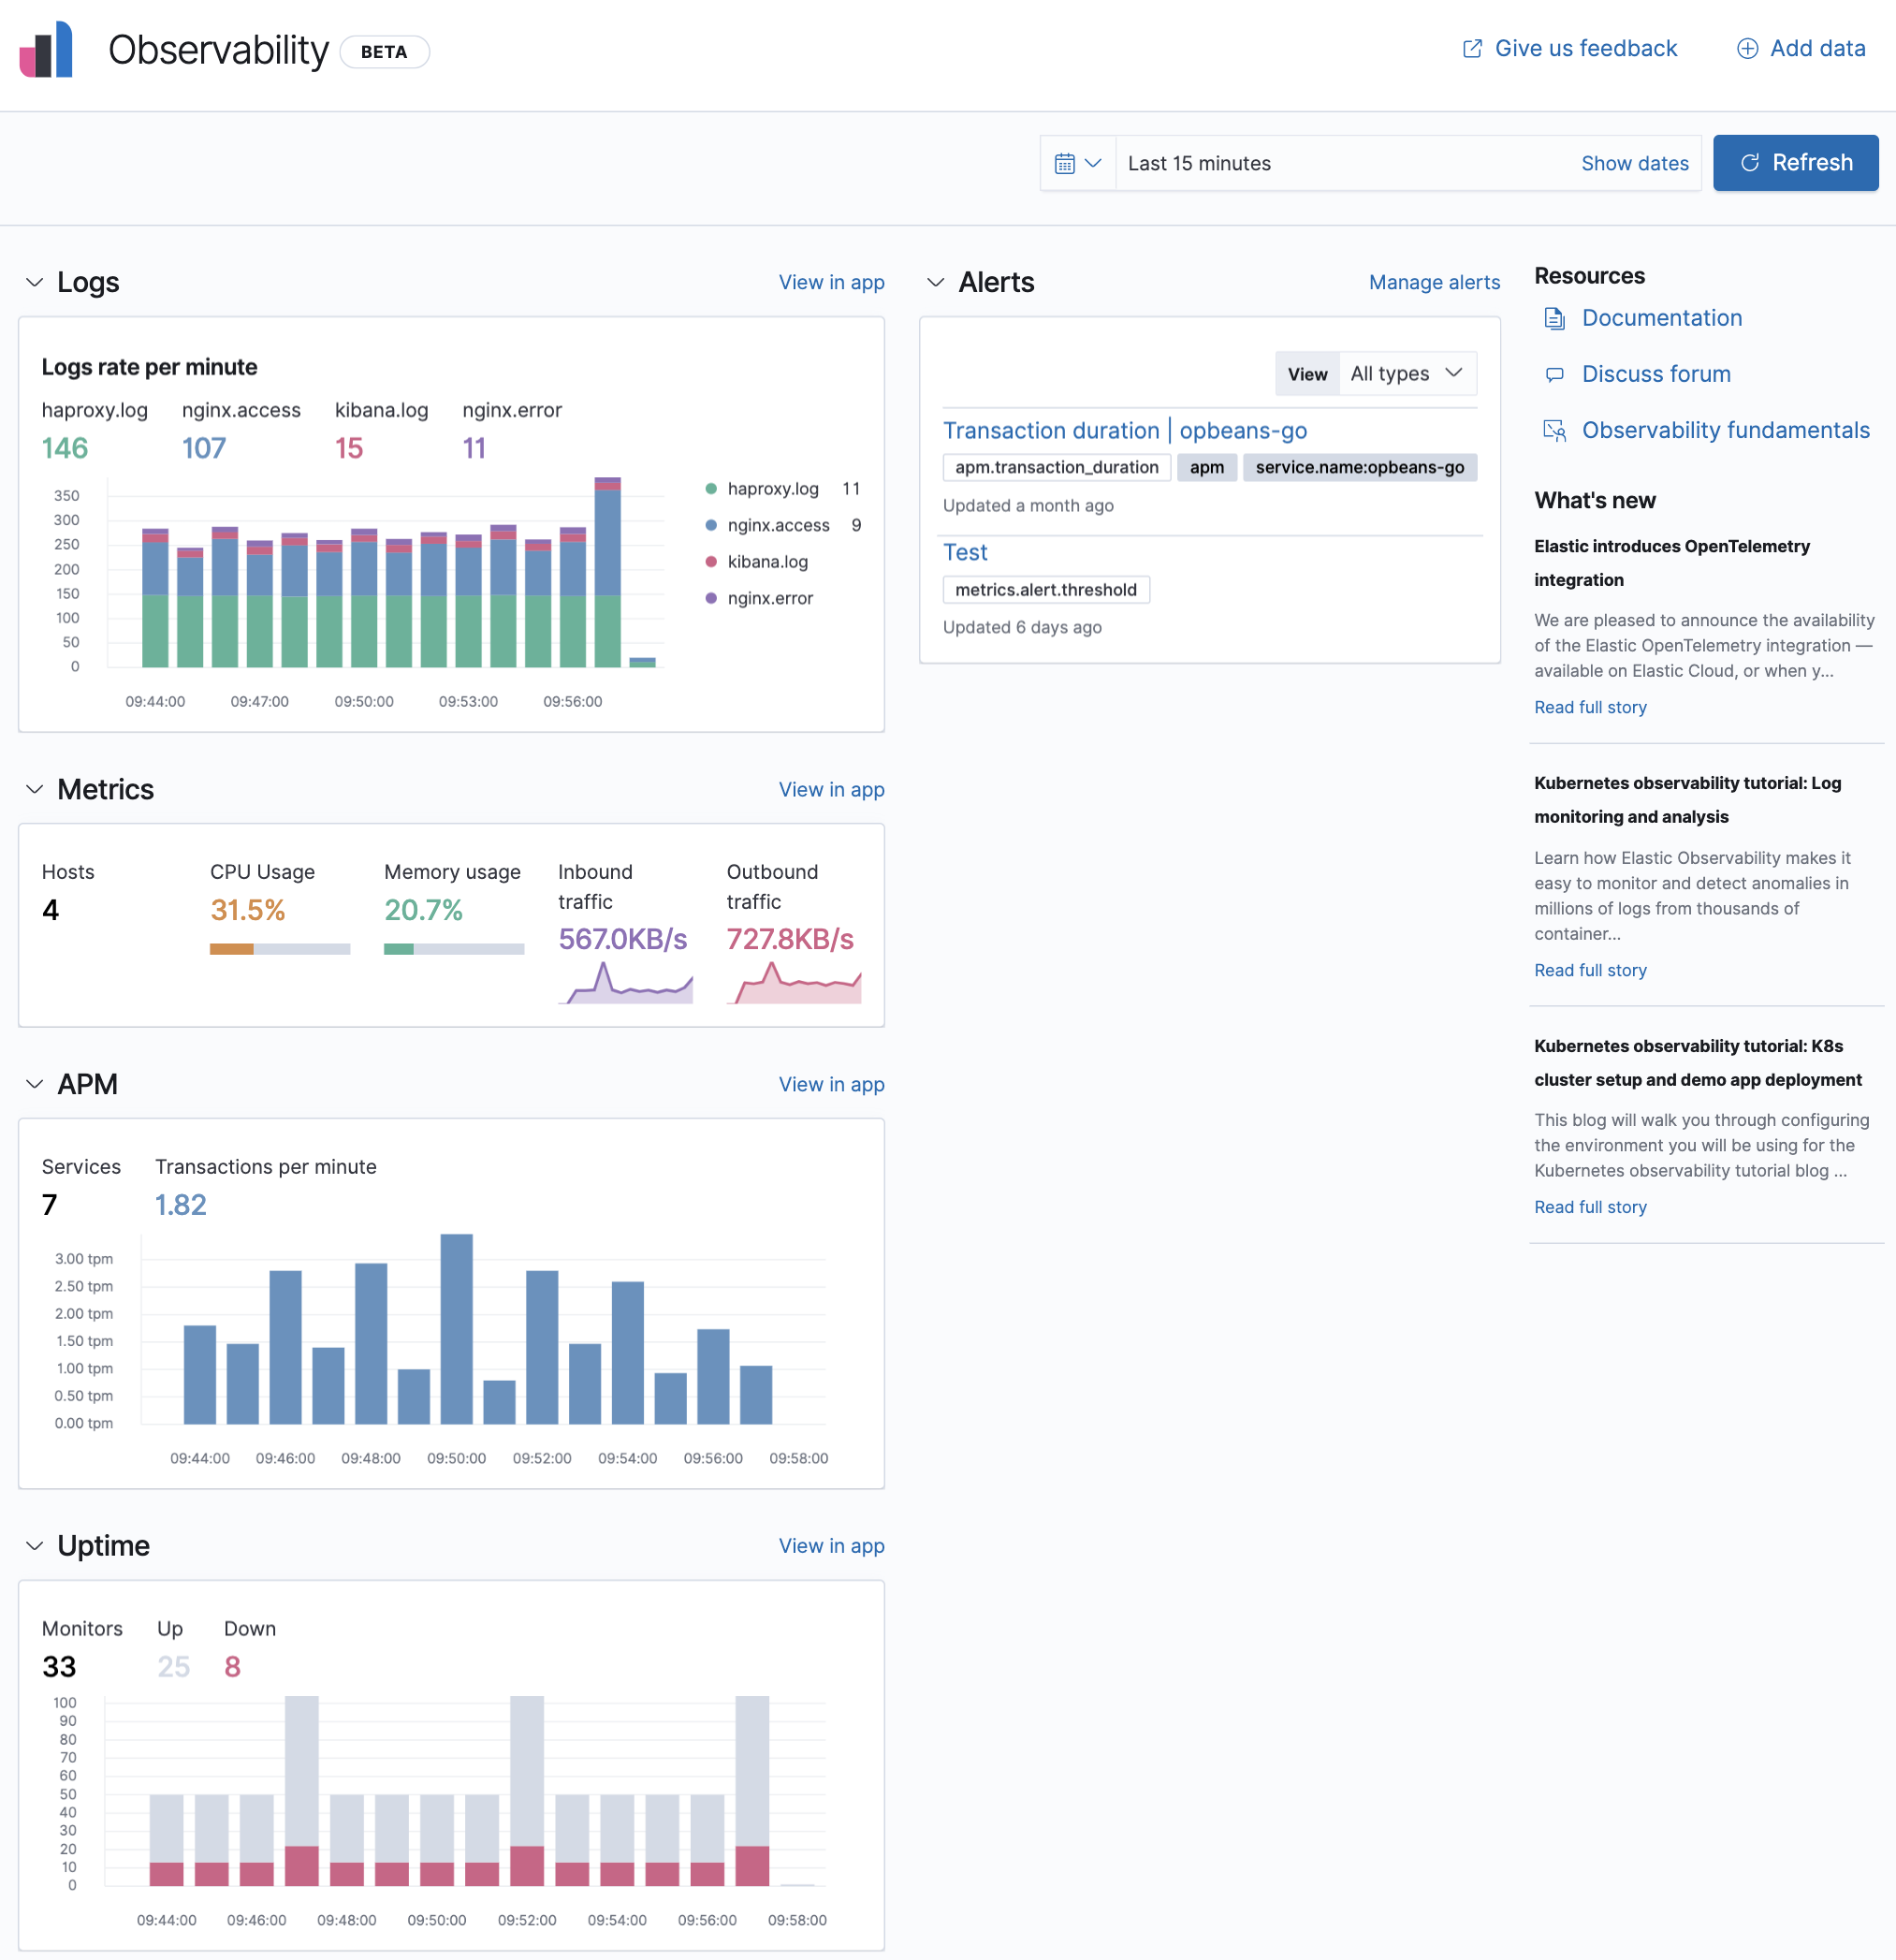
editObservability enables you to add and monitor your logs, system metrics, uptime data, and application traces, as a single stack.
With Observability, you have:
- A central place to add and configure your data sources.
- A variety of charts displaying analytics relating to each data source.
- View in app options to drill down and analyze data in the Logs, Metrics, Uptime, and APM apps.
- An alerts chart to keep you informed of any issues that you may need to resolve quickly.
Get started
editKibana provides step-by-step instructions to help you add and configure your data sources. The Observability Guide is a good source for more detailed information and instructions.