IMPORTANT: No additional bug fixes or documentation updates
will be released for this version. For the latest information, see the
current release documentation.
Inspecting a Visualization from the Dashboard
edit
IMPORTANT: This documentation is no longer updated. Refer to Elastic's version policy and the latest documentation.
Inspecting a Visualization from the Dashboard
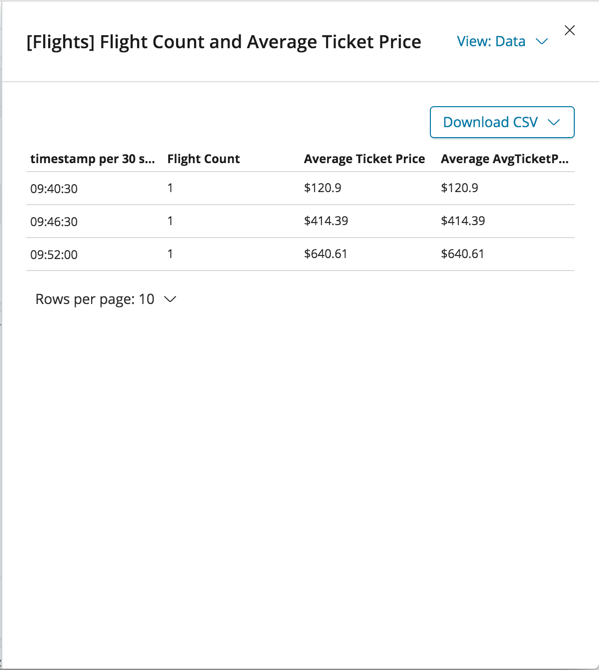
editMany visualizations allow you to inspect the data and requests behind the visualization.
In the dashboard, expand the visualization’s panel menu (or gear menu if in Edit mode) and select Inspect.
The initial view shows the underlying data for the visualization. To view the requests that were made for the visualization, choose Requests from the View menu.
The views you’ll see depend on the element that you inspect.