WARNING: Version 6.2 of Kibana has passed its EOL date.
This documentation is no longer being maintained and may be removed. If you are running this version, we strongly advise you to upgrade. For the latest information, see the current release documentation.
Visualizing Your Data
edit
IMPORTANT: This documentation is no longer updated. Refer to Elastic's version policy and the latest documentation.
Visualizing Your Data
editIn the Visualize application, you can shape your data using a variety of charts, tables, and maps, and more. You’ll create four visualizations: a pie chart, bar chart, coordinate map, and Markdown widget.
- Open Visualize.
-
Click Create a visualization or the + button. You’ll see all the visualization types in Kibana.
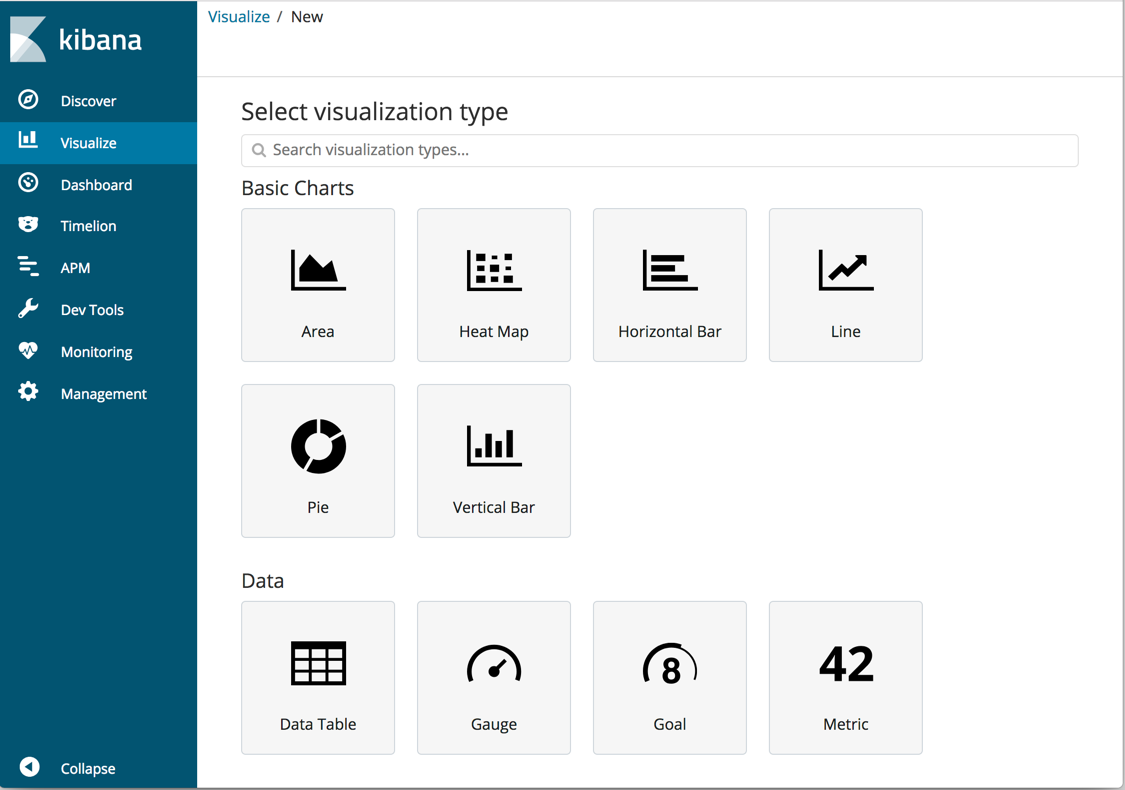
- Click Pie.
-
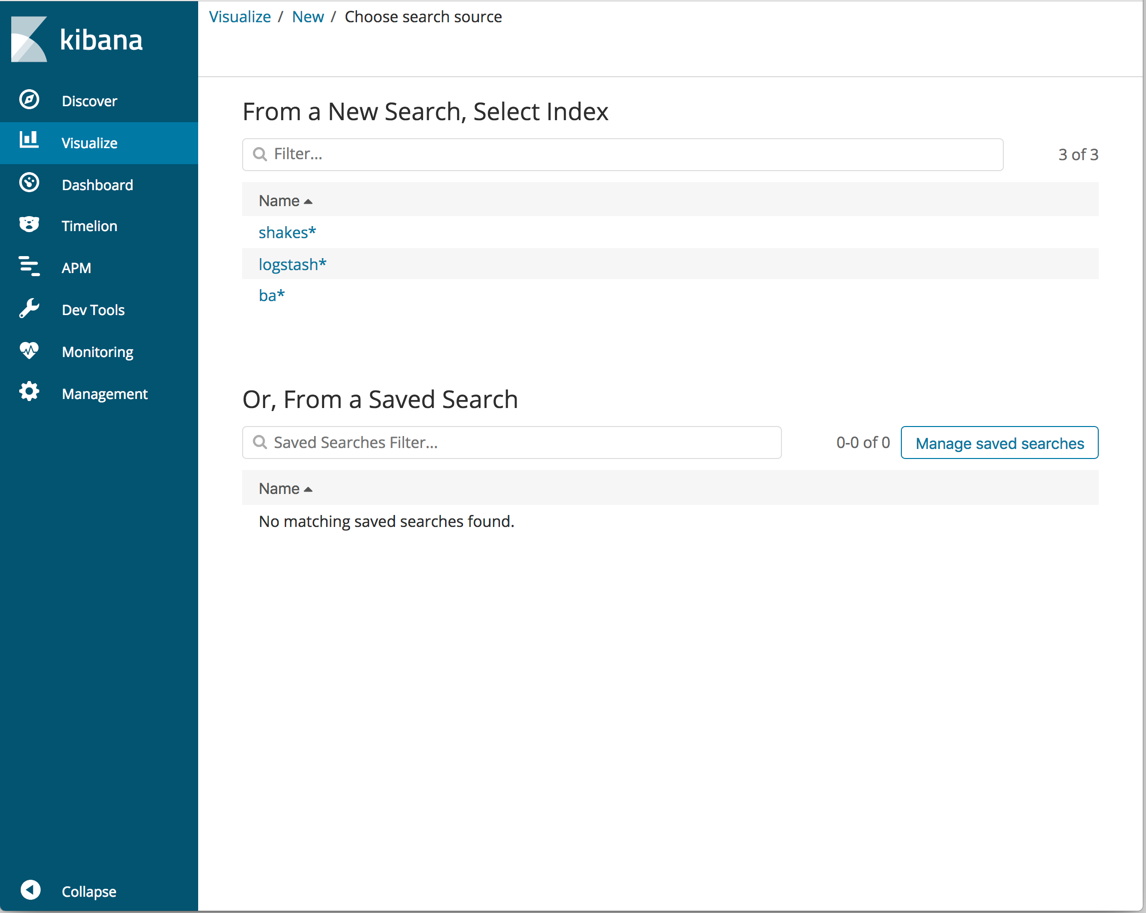
In New Search, select the
ba*index pattern. You’ll use the pie chart to gain insight into the account balances in the bank account data.