创建基于时间序列的可视化控件
edit
IMPORTANT: This documentation is no longer updated. Refer to Elastic's version policy and the latest documentation.
创建基于时间序列的可视化控件
edit本教程会使用来自 Metricbeat 的时间序列数据为您演示 Timelion 所能提供的功能。您可以先下载 Metricbeat 并根据这个说明在本地抽取数据。
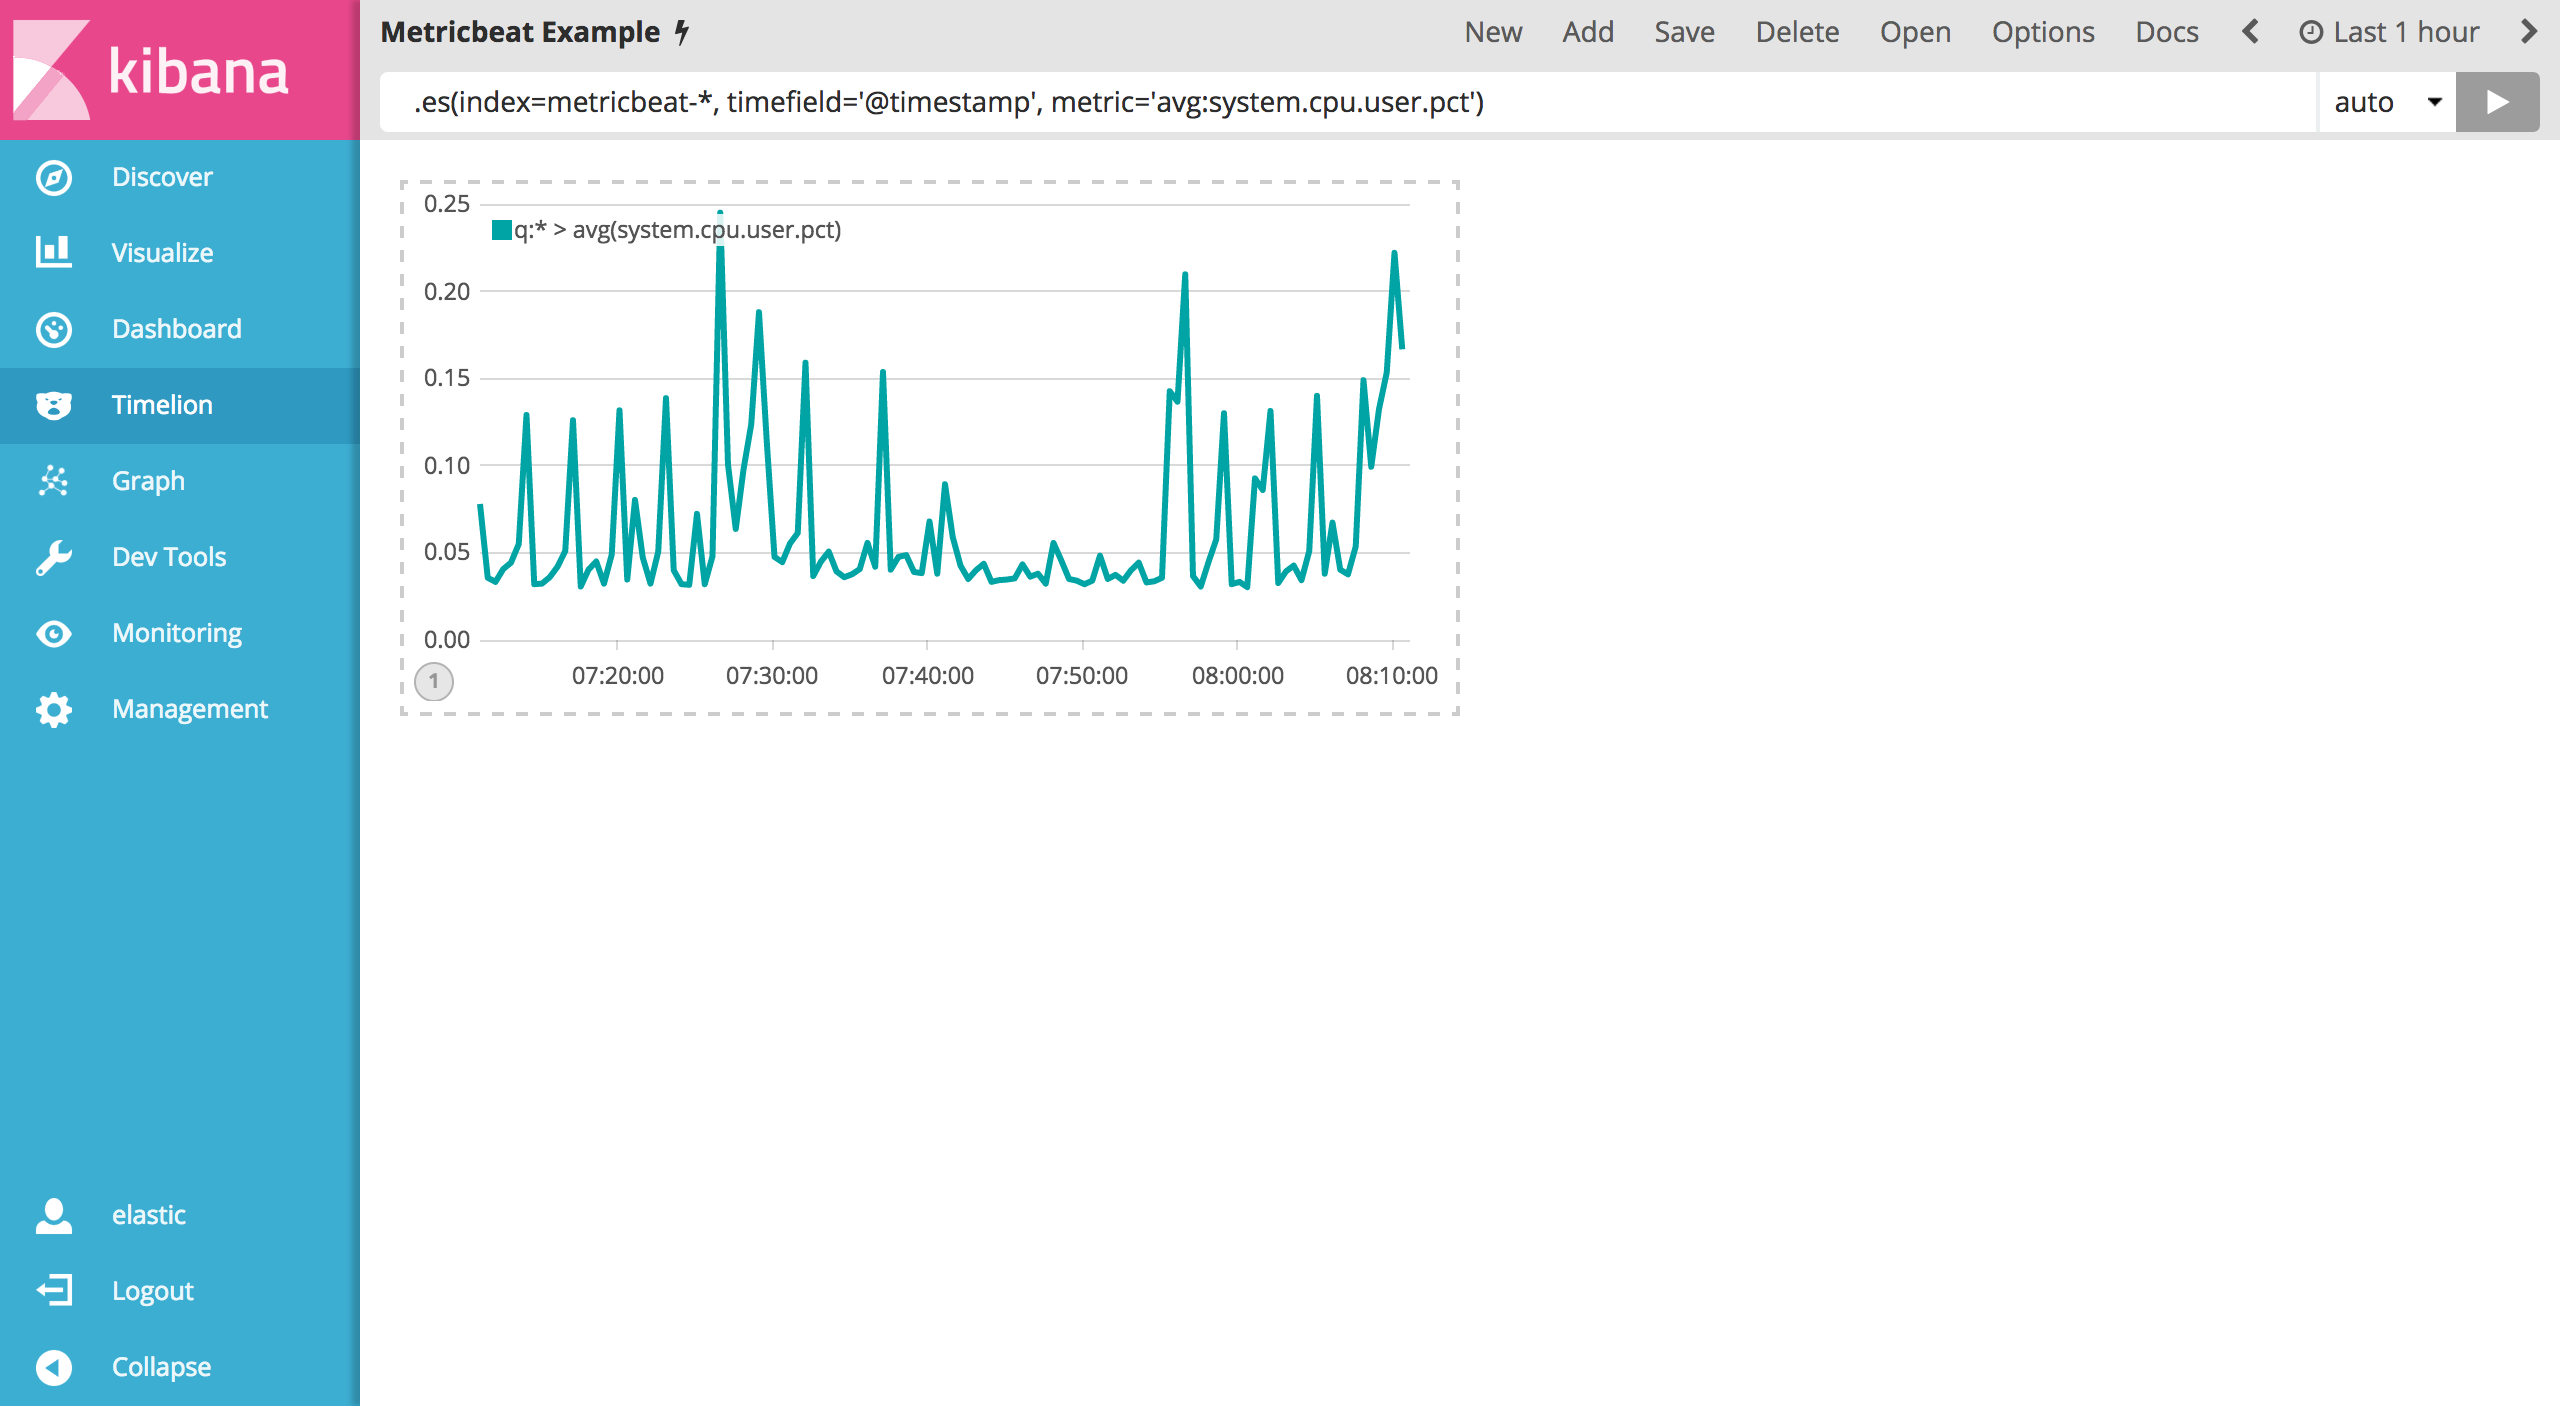
第一个可视化控件将会对比系统用户空间 CPU 实时使用百分比和其每小时的平均偏移量。为了创建这个控件,我们需要创建两个 Timelion 表达式。第一个是实时的 system.cpu.user.pct 平均值,第二个是每小时的平均偏移量。
您需要在第一个表达式中定义 index 、 timefield 和 metric 。然后紧接着在 Timelion 查询框中输入如下表达式:
.es(index=metricbeat-*, timefield='@timestamp', metric='avg:system.cpu.user.pct')
现在您需要添加前一个小时的数据用来对比。您需要添加一个 offset 参数到 .es() 函数。 offset 将会利用表达式来指定时间序列偏移量。举个例子,如果您想让时间偏移一个小时那么将会使用时间表达式 -1h 。 使用逗号分隔两个时间序列表达式,例如在 Timelion 查询框中输入如下表达式:
.es(index=metricbeat-*, timefield='@timestamp', metric='avg:system.cpu.user.pct'), .es(offset=-1h,index=metricbeat-*, timefield='@timestamp', metric='avg:system.cpu.user.pct')
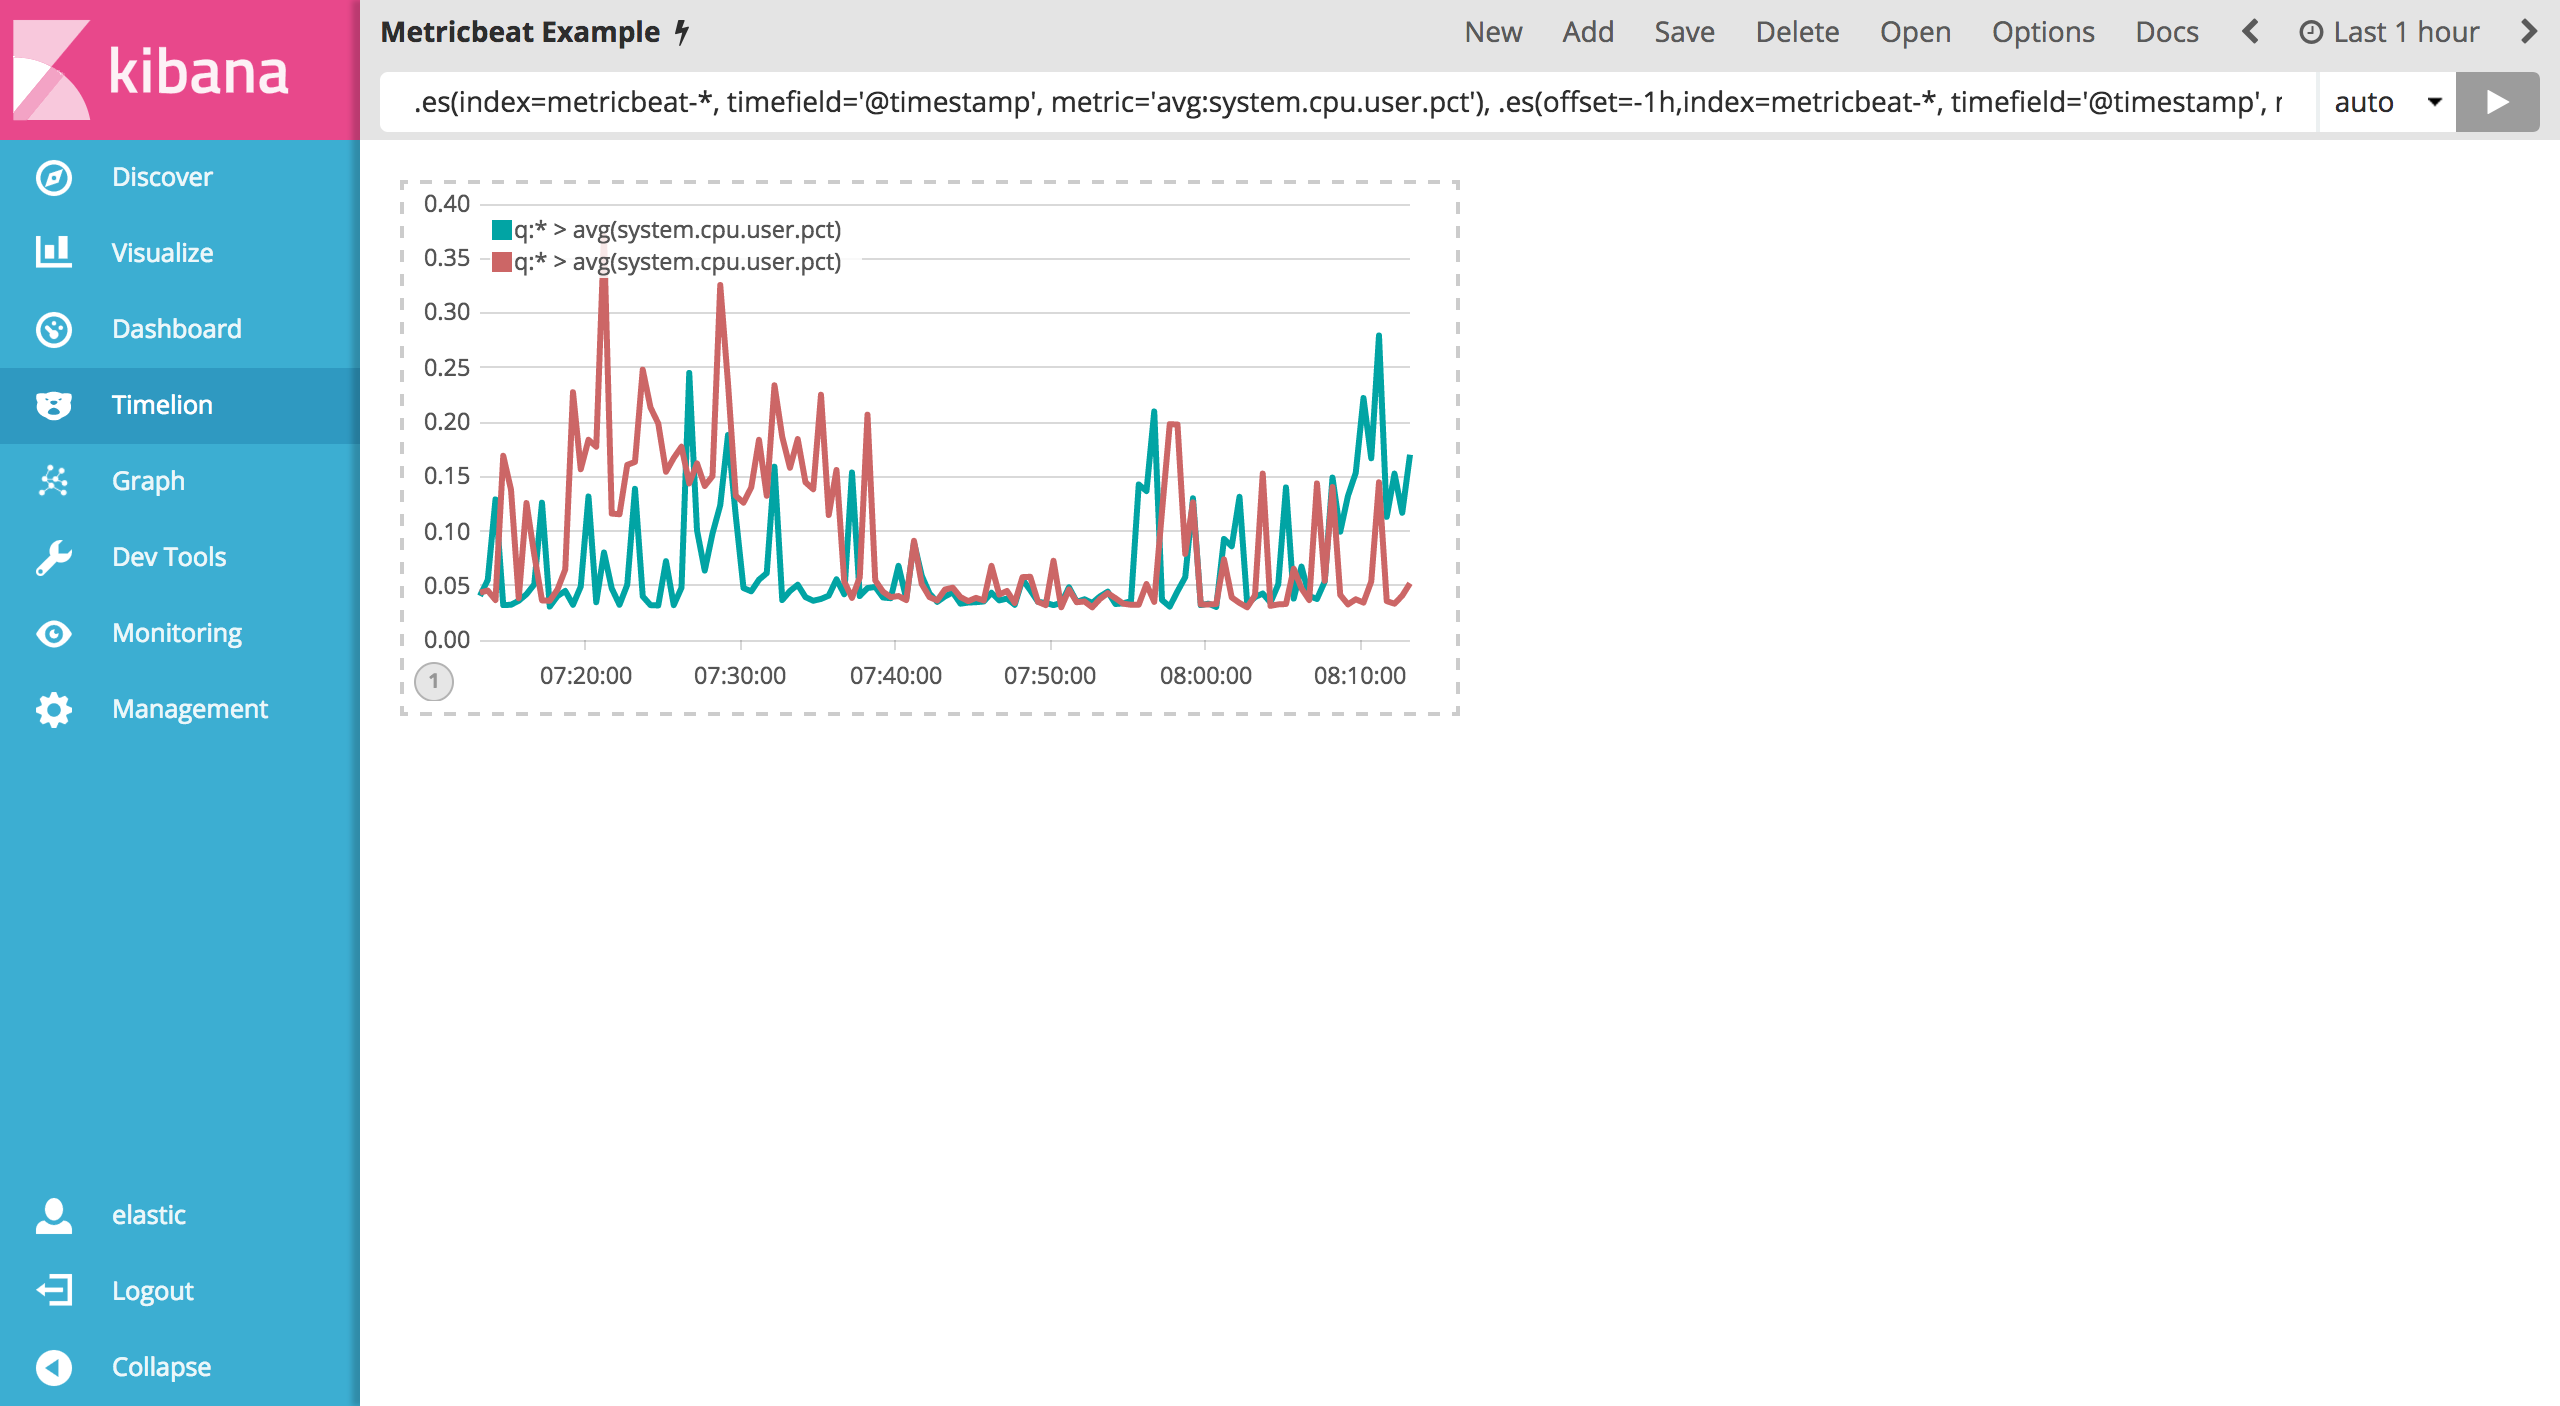
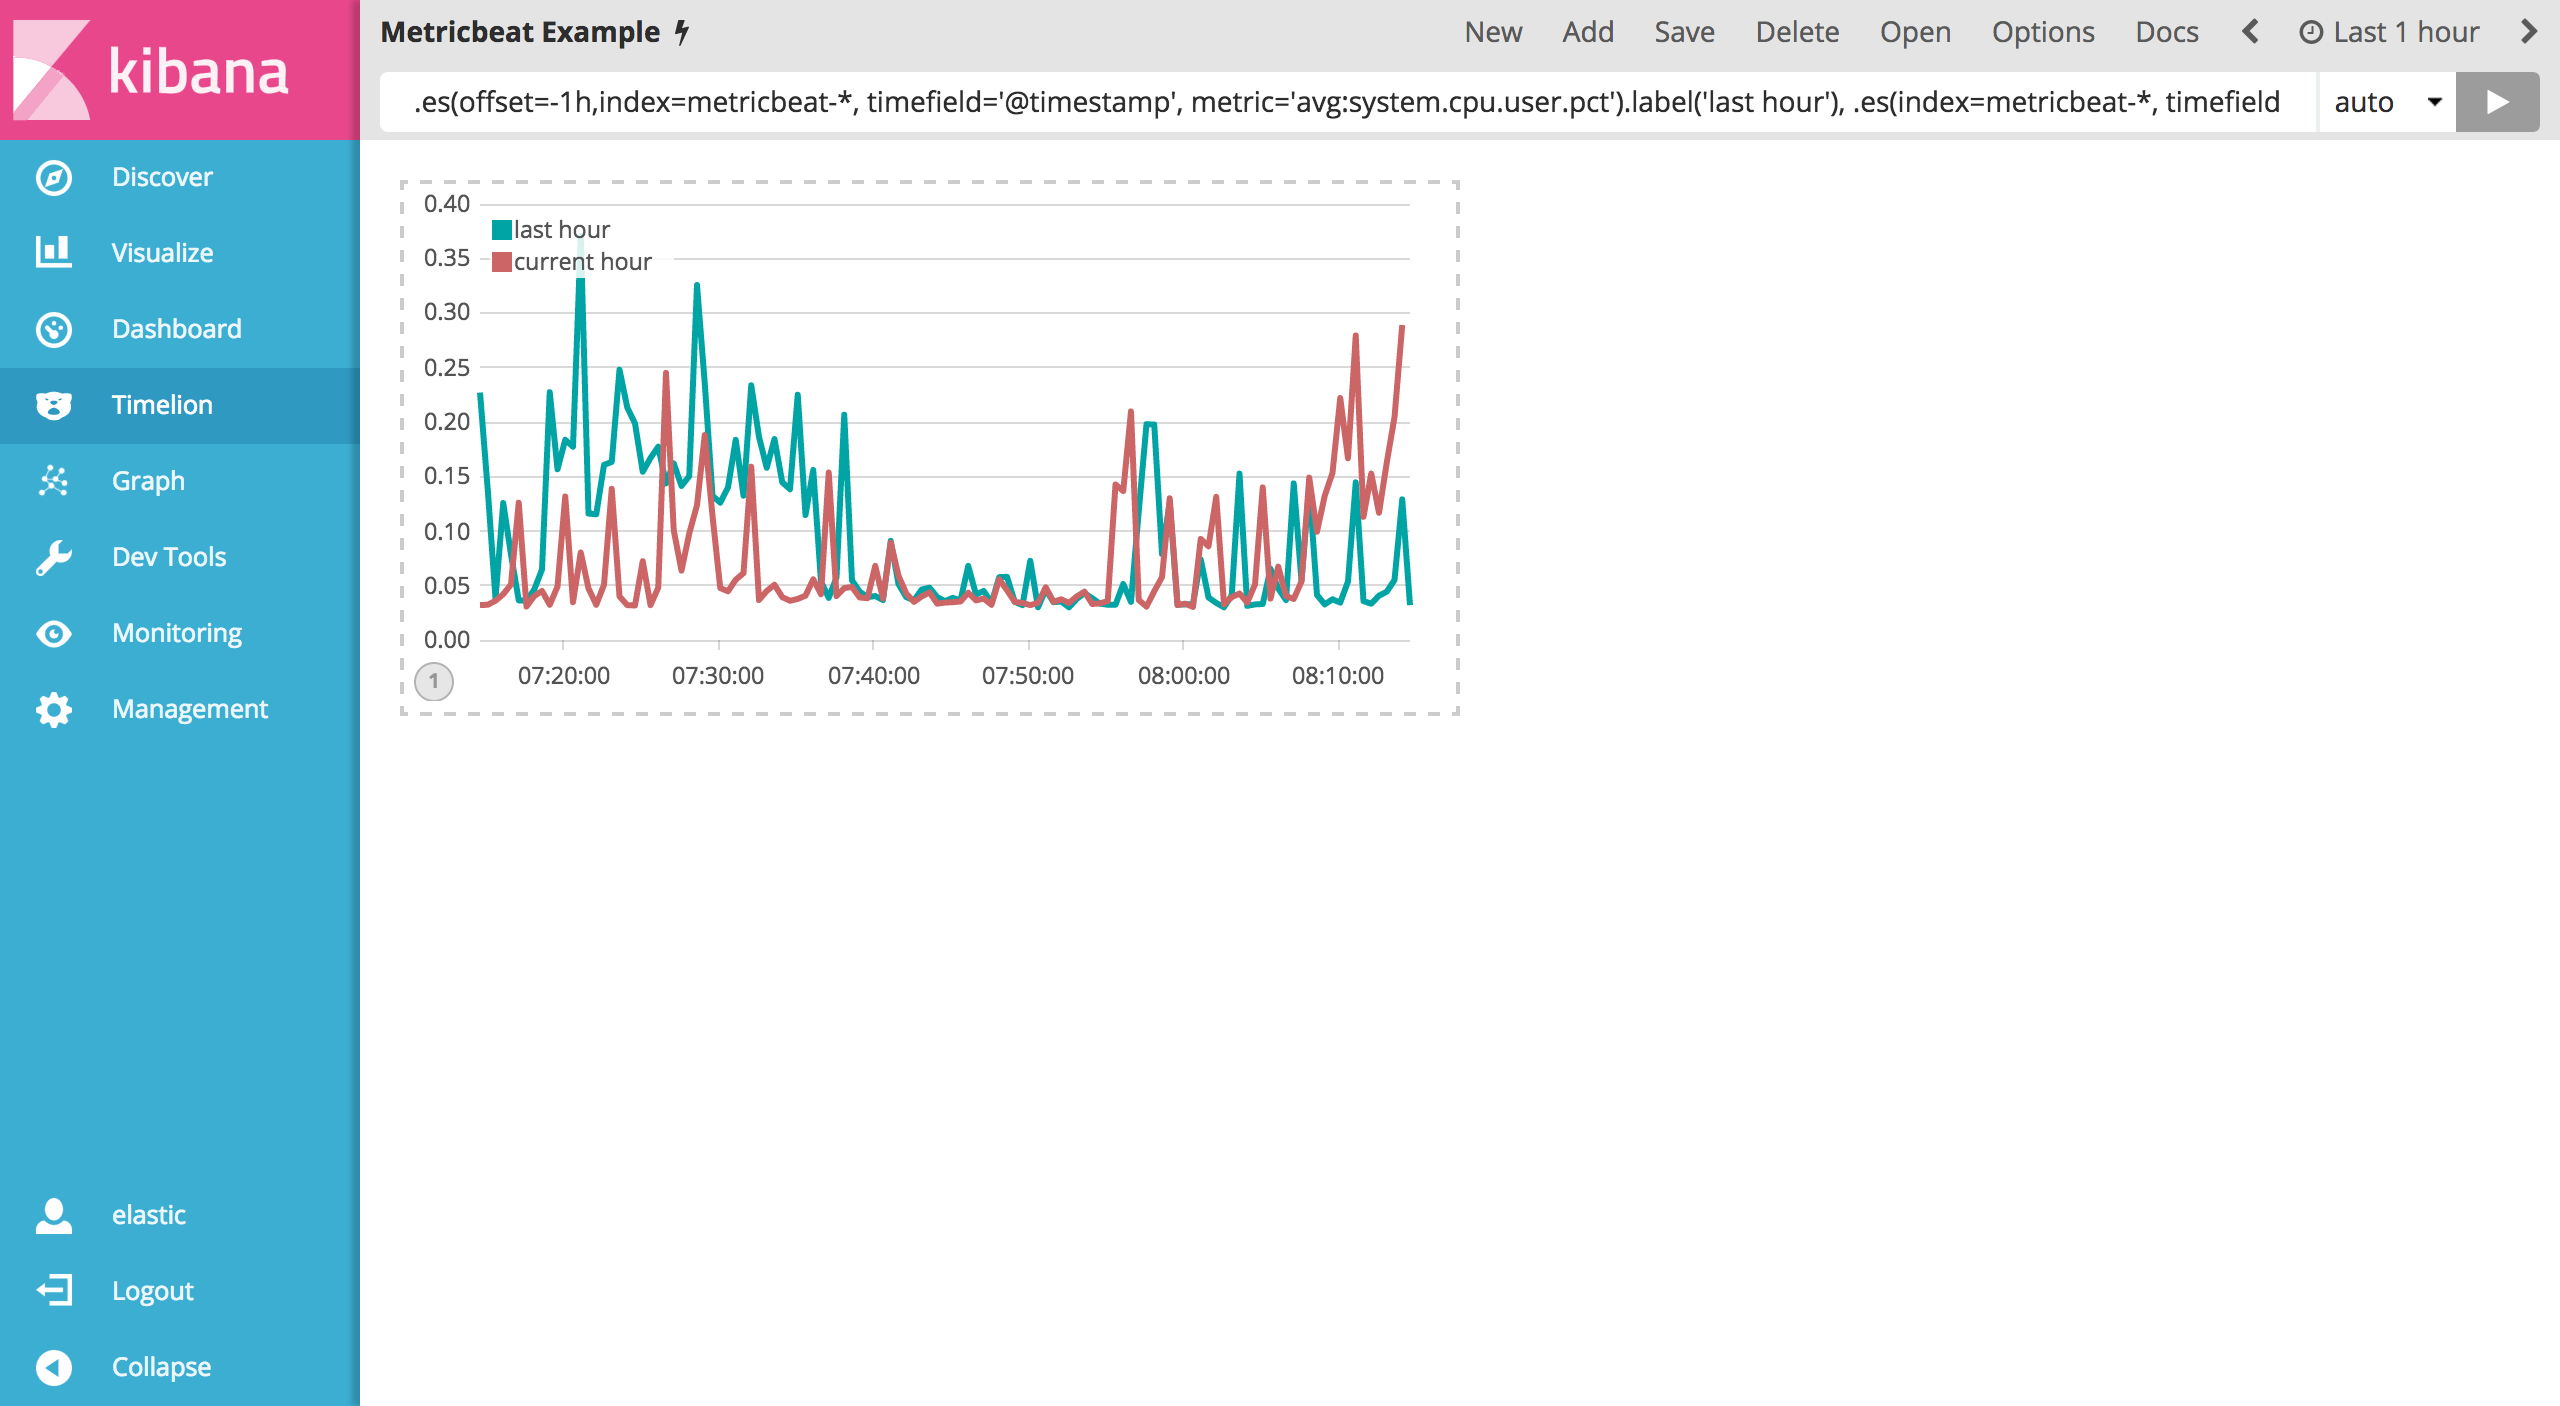
图形上有点难区分上述两个序列表达式。我们可以通过给每个序列自定义标签来区分它们。您可以在任何一个序列后面添加 .label() 表达式来自定义标签。我们来看看如下自定义标签的例子:
.es(offset=-1h,index=metricbeat-*, timefield='@timestamp', metric='avg:system.cpu.user.pct').label('last hour'), .es(index=metricbeat-*, timefield='@timestamp', metric='avg:system.cpu.user.pct').label('current hour')
保存整个 Timelion 表格为 Metricbeat Example 。Timelion 是一个非常强大的基于时间序列的控件,您可以对本教程中的一些关键点多加练习来熟悉 Timelion。